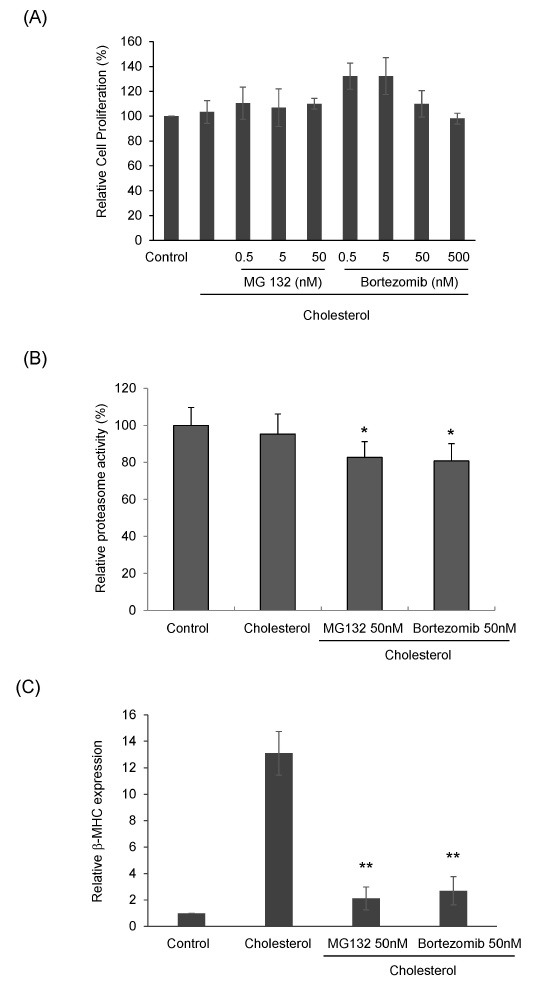
Fig. 2. The effect of proteasome inhibitors on cholesterol-induced cardiac hypertrophy. (A) H9c2 cells were plated on a 96-well plate and treated with MG132 (0.5-50 nM) or Bortezomib (0.5-50 nM) in the presence of ET-1 (100 nM), IGF-1 (50 ng/ml), and cholesterol (5 μg/ml) for 24 h after starvation for 4 h in a serum-free medium. After incubation with WST-1 for 1 h, the absorbance at 450 nm was measured using a Spectra MaxⓇ M3 Microplate Reader (Molecular Devices, USA). The relative cell viability was calculated by comparison to the control cells. The values shown are the mean ± S.D. from three independent experiments. (B) The proteasome activity in cell lysates was quantified using the Proteasome Activity Fluorometric Assay Kit (BioVision). Cell lysates were incubated with fluorogenic substrate and Succ-LLVY-AMC. Fluorescence intensity (350 nm excitation, 440 nm emission) was then measured using a Spectra MaxⓇ M3 Microplate Reader (Molecular Devices, USA). The relative proteasome activity was calculated by comparison to the control cells. The values shown are the mean ± S.D. from three independent experiments. *P <0.05 vs control. (C) Total RNA was isolated from cells with MG132 (0.5-50 nM) or Bortezomib (0.5-50 nM), with or without cholesterol (5 μg/ml) for 24h using TrizolⓇ reagent. qRT-PCR was performed for primers specific to β-MHC. The expression of the target genes was expressed as the relative expression level after normalization to the levels of actin, the internal control. The values shown are the mean ± S.D. from three independent experiments. **P < 0.01 vs control.

