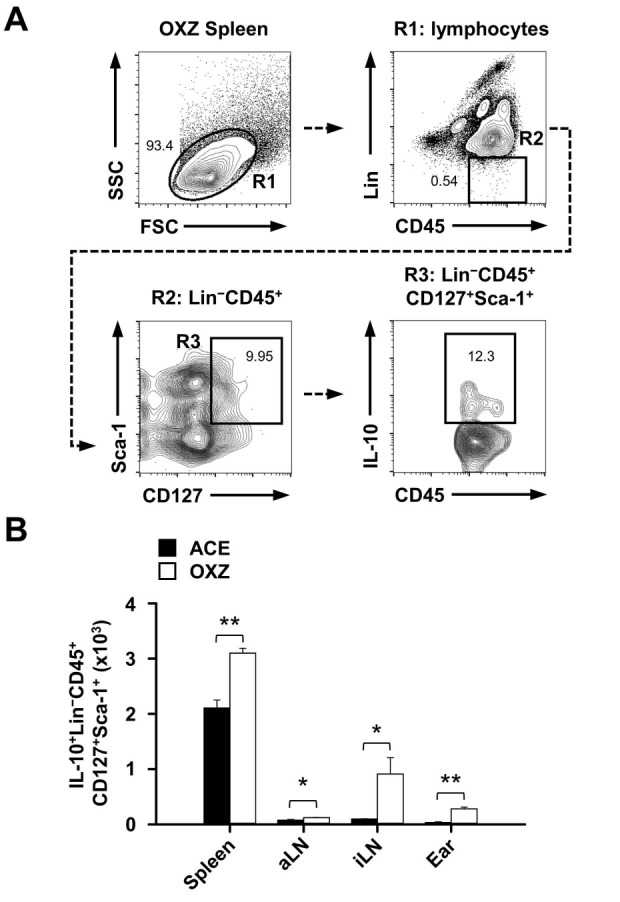
Fig. 4. Population change of IL-10-producing innate lymphoid cells in contact hypersensitivity mouse model. (A) Dot plots show a representative analysis of IL-10 expression in splenic ILCs (Lin−CD45+CD127+Sca-1+) from contact hypersensitivity mice. (B) The number of IL-10+ cells in ILCs in spleen, aLN, iLN, and ear tissues were measured by flow cytometry as described in “Materials and Methods.” Data are the mean ± SEM from three independent experiments. *P < 0.05; **P < 0.01. OXZ, ozaxolone; ACE, acetone; aLN, axillary lymph node; iLN, inguinal lymph node.