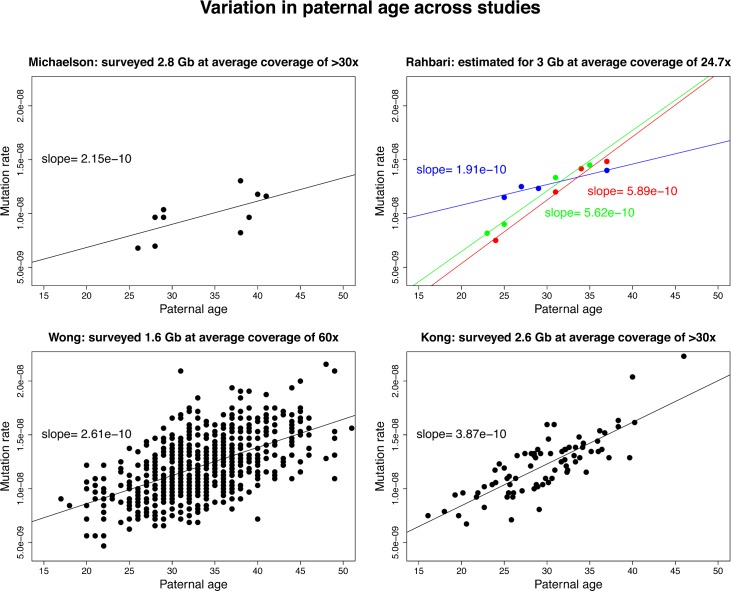
Fig 3. Variation in the estimated paternal age effect for autosomes.
We plot the de novo mutation rate as a function of the paternal age at conception of the child. The rate was obtained from the reported counts of de novo mutations divided by the fraction of the genome assayed in each study (shown in the title of each subplot, along with the mean sequence coverage per individual). The solid line denotes the fitted slope (i.e., the increase in the mutation rate for each additional year of father’s age). Following the approach of Rahbari et al. 2015 [46], for their study, we used the corrected counts of de novo mutations, which are extrapolated to a genome length of 3 Gb (thereby assuming the mutation rate in the inaccessible regions of the genome is the same as that in surveyed regions). The three colors used in this plot denote the three different families that were studied: blue, family 244; green, family 603; and red, family 569.

