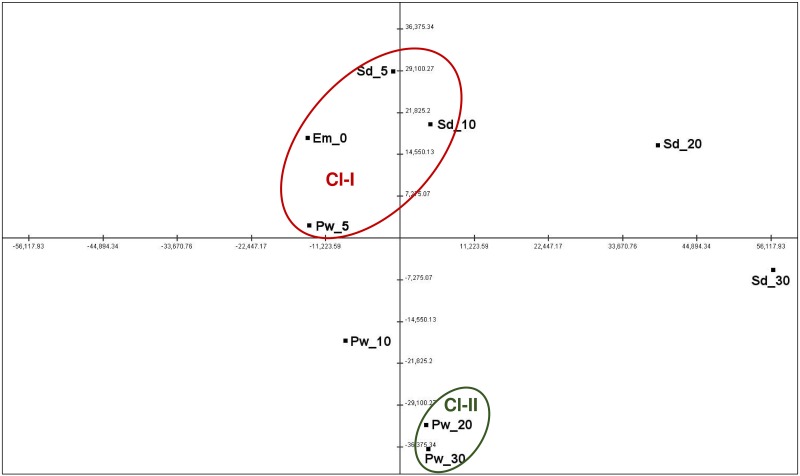
Fig 3. Principal component analysis depicting correlation among samples based on gene expression data.
Samples formed two clusters representing early stage of seed development (Cl-I) and late pod wall development (Cl-II). Red color depicts the cluster of samples from the early stage of seed development, while green color depicts cluster of sample that represents pod wall development.

