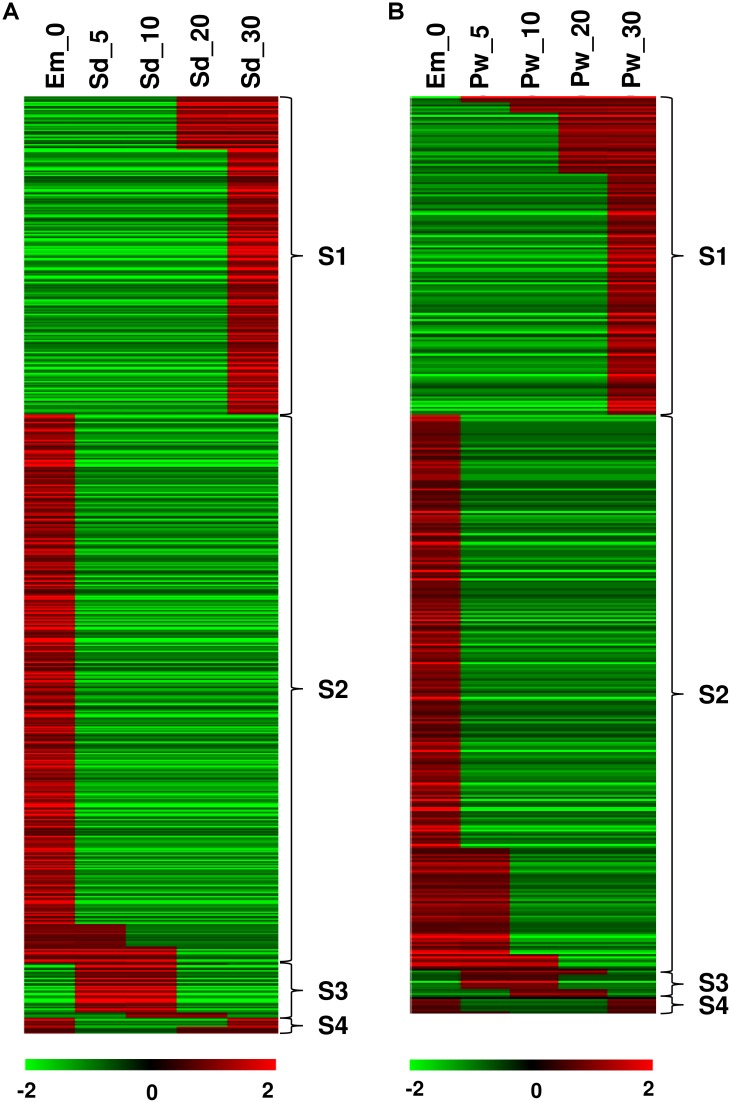
Fig 6. Temporal expression patterns in seed and pod wall.
Figure depicts temporal patterns of gene expression in (A) developing seed from Em_0 to Sd_30 and in (B) developing pod wall from Em_0 to Pw_30. The transitions in the pattern of gene expression were studied using StepMiner algorithm. Between two consecutive time points, four different transitions were identified, namely one-step-up, one-step-down, two-step-up-down and two-step-down-up transitions which were referred as S1, S2, S3 and S4, respectively. Red color depicts up-regulation and the green color shows down-regulation.

