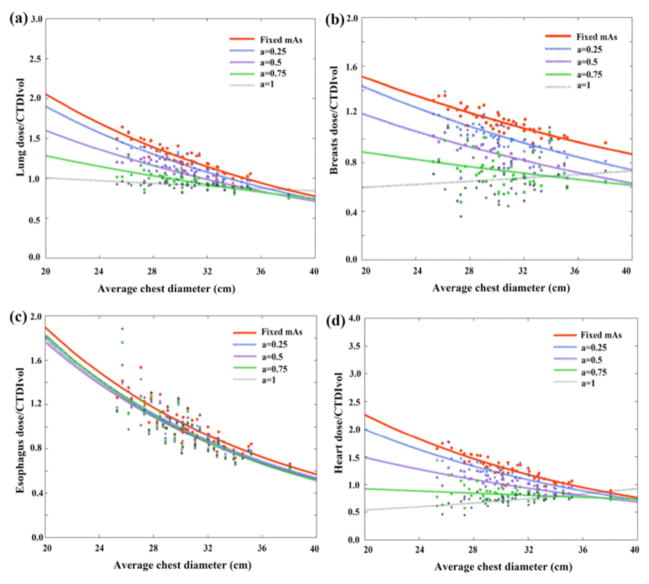
Figure 7.
Example CTDIvol-normalized-organ dose coefficients for chest scans plotted against the average abdominopelvic diameter at five modulation strengths. Among the five curves, the CTDIvol-normalized-organ dose at constant tube current condition (a = 0) was used as the prediction basis. The other four curves were used as the gold standard for the prediction.

