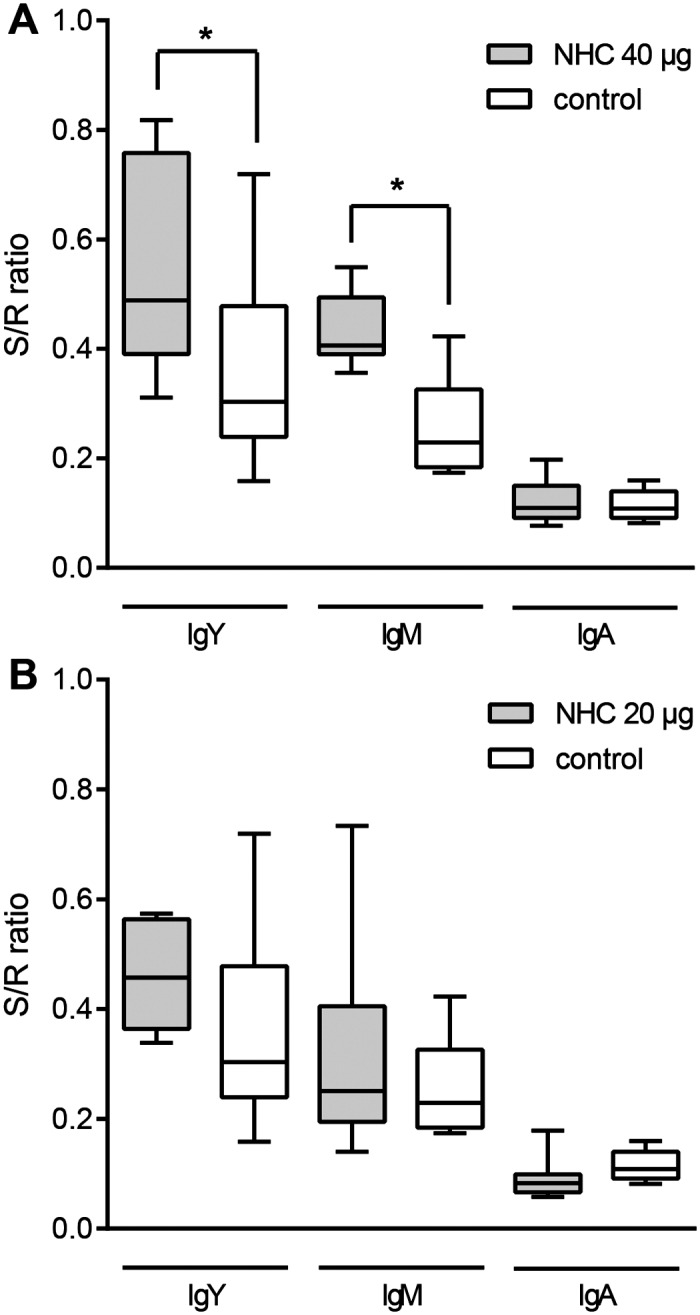
Fig 3. Antigen-specific serum antibody responses.

NHC flagellin-specific antibody levels in the groups immunized with (A) 40 μg of NHC protein and (B) 20 μg of NHC protein, both compared to levels in the solvent injected control group. Antigen-specific IgY, IgM or IgA antibody levels were determined in 20-fold diluted sera collected from 12 day-old individual animals. Results are displayed as a box-and-whisker plot (S/R, sample to reference ratio). An asterisk indicates statistically significant differences (α < 0.05) between compared groups.
