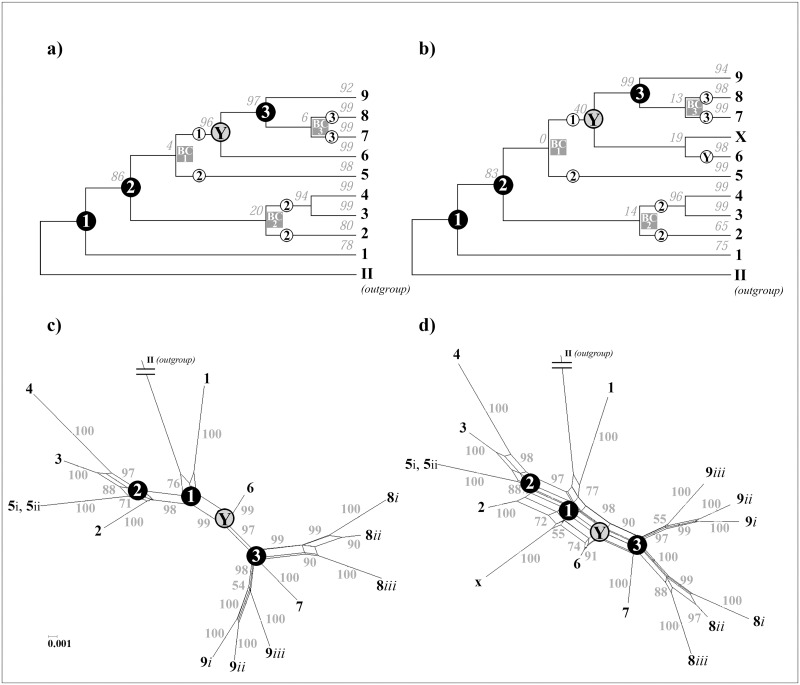
Fig 1. Maximum Likelihood trees and NeighborNet networks of the Ia subgenogroup.
In diagrams a) and b) the phylogenetic relationship between the Ia clades (clades 1–9), based on the complete G gene sequence, is illustrated as a bifurcating maximum likelihood tree, whereas in diagrams c) and d) it is shown as a NeighborNet network. Diagram a) is based on 650 Ia isolates (S1 Table), diagram b) on 651 Ia isolates (the same isolates as in a) plus the isolate U288000, designated as X). Diagrams c) is based on isolates with the GenBank accession-number AY546571 (9i), LN877188 (9ii), EU708732 (9iii), EU708755 (8iii), EU708748 (8ii), LN877010 (8i), LN876935 (7), AJ233396 (6), LN876803 (5), EU708742 (4), FRG2192 (3), LN876782 (2), and AY546617 (1), diagram d) is based on the same isolates as in c) plus the isolate X. These isolates each represent the Ia clade isolate with the oldest collection date. Isolate AY546576 (VHSV genogroup II) is the outgroup in each diagram. The phylogenetic trees are pictured as cladograms. Numbers above branches represent the bootstrap support values obtained from 250 replicates. In case of the networks, the formation of parallelograms indicates possible alternative split events, and the small gray numbers are bootstrap values for each branch (shown only for values>50%). Black circles marked “1–3” represent nodes that correspond in the networks with a polytomy. Gray squares marked “BC1–3” represent nodes that occur only in the trees due to a bifurcation conflict. In the tree diagrams, the bootstrap support value of node Y was increased from 40% to 96% when isolate X was excluded. Small white circles marked “1–3” on a branch indicate the respective connection of this branch to the node 1–3 in the networks.

