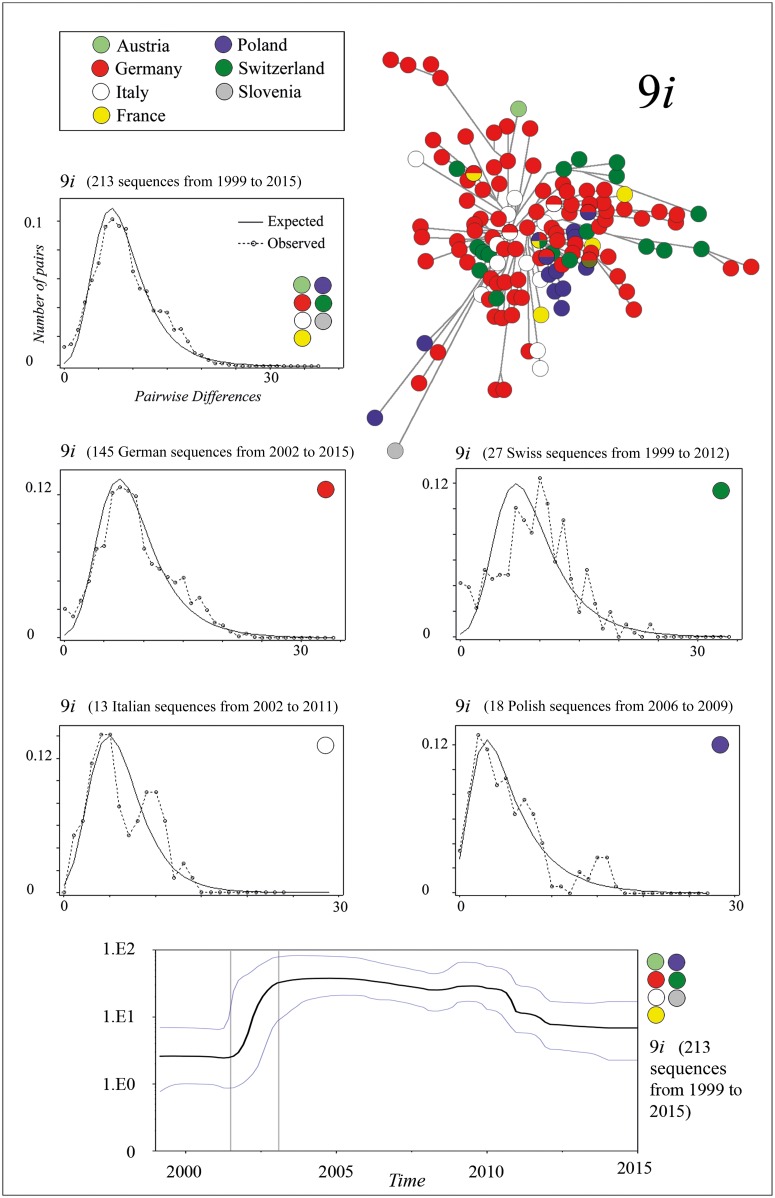
Fig 3. Mismatch distributions and Bayesian skyline plot of 9i sequences.
The mismatch distribution is based on the complete G gene sequence and is calculated separately for the following: 213 9i sequences from Austria, France, Germany, Italy, Poland, Switzerland, and Slovenia, collected between 1999 and 2015; 145 German 9i sequences from 2002 to 2015; 27 Swiss 9i sequences from 1999 to 2012; 13 Italian 9i sequences from 2002 to 2011; and 18 Polish 9i sequences from 2006 to 2009. Table 1 lists the respective value of the raggedness index (r), nucleotide diversity (PI), Tajima’s D, and Fu’s Fs of each dataset. The Bayesian skyline plot shows changes of the 9i population size between 1999 and 2015. The plot was generated using all 213 9i sequences (complete G gene sequence). X axis: time in years, Y axis: population size. The middle solid line is the median estimate, and the area between the blue lines shows the 95% highest probability density (HPD).

