Fig 3.
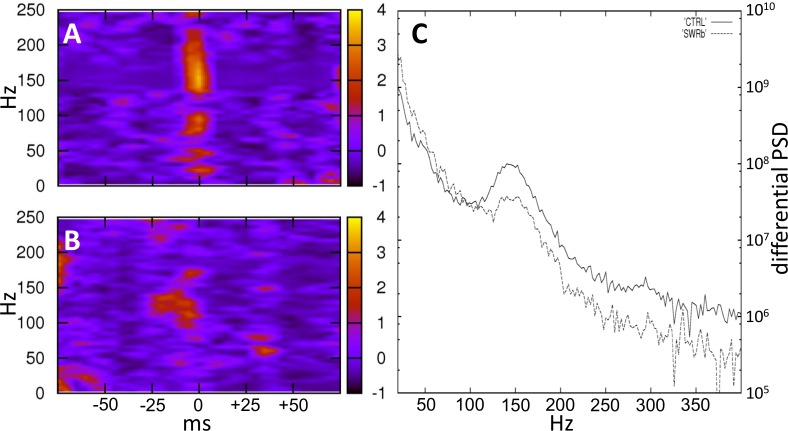
Vanishing high frequency oscillatory activity in the SWR-blockade condition (A) In the control condition, light-time triggered power spectrum shows a prominent peak at 150 Hz and higher frequencies. Here all the data points were shifted forward by 1.32 s, so that the SWR event that actually triggered the light appear at time 0. (B) In the SWR-blockade condition, virtually no oscillatory activity is observable above 150 Hz around the onset of the laser pulse. (C) Normalized power spectrum around off-line detected SWR events. To perform the normalization, spectra were calculated using the multi-taper method around the events, then around time points shifted by 400 ms, and the latter was subtracted from the former. In total, 643 off-line detected SWR events were used for the control condition (continuous line) and 348 for the SWR-blockade condition (dashed line). All of the data presented here (A, B, C) were from the first 20 minutes of the middle sleep and from one example tetrode for each of the conditions. The other tetrodes showed similar activity.

