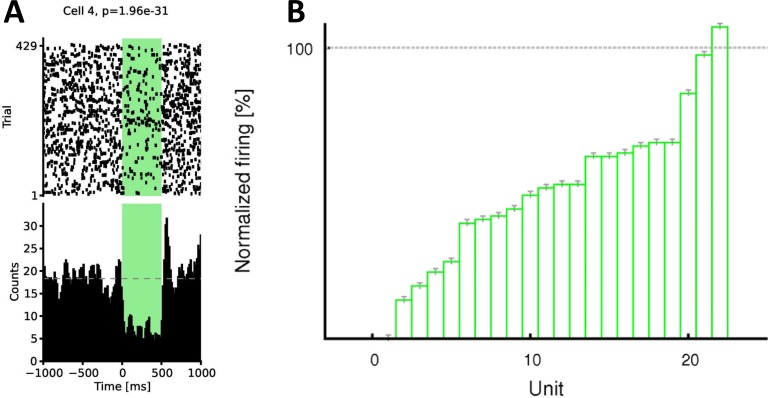
Fig 4. Efficiency of the inhibition.
(A) Efficiency of the optogenetic inhibition of one single CA1 pyramidal cell. Regularly timed 500 ms long half-intensity light pulses were delivered during the final 30 minute long sleep/rest of the day. Spiking activity is displayed as a raster plot centered around the onset of the light pulse (left) and as histogram using 10 ms bins (right). Rebound activity after inhibition can also be observed on the histogram. P-value derived from the Wilcoxon signed rank sum test is shown above the raster. (B) Efficiency of the optogenetic inhibition at population level (22 pyramidal cells are shown from one example recording day). Similarly to other recording days, about 90% of all pyramidal cells were significantly inhibited by the regular 500 ms light pulses.

