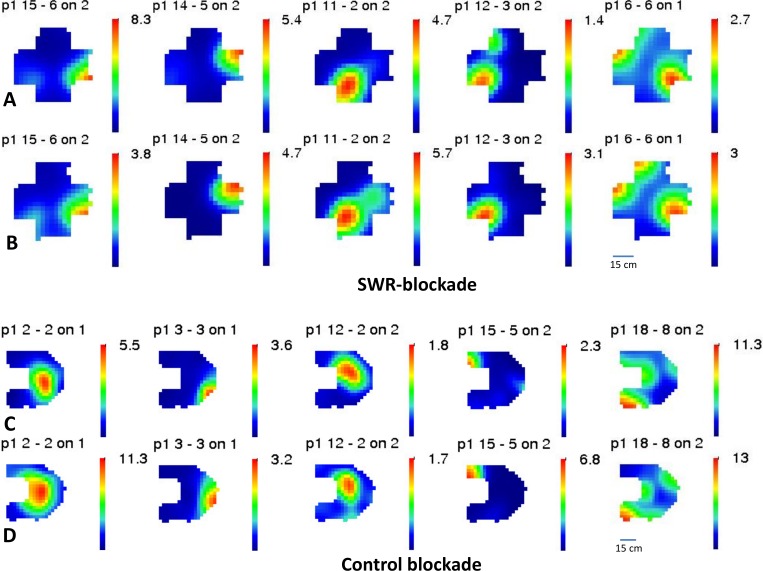
Fig 6. Stability of the firing rate maps.
A selected set of 10 CA1 pyramidal cells, recorded on an SWR-blockade day (A, B) and on a control day (C, D) is shown. For each day, the upper row shows the rate maps before inhibition (A, C), the lower one the rate maps after inhibition (B, D). Note the substantial level of stability on SWR-blockade days.

