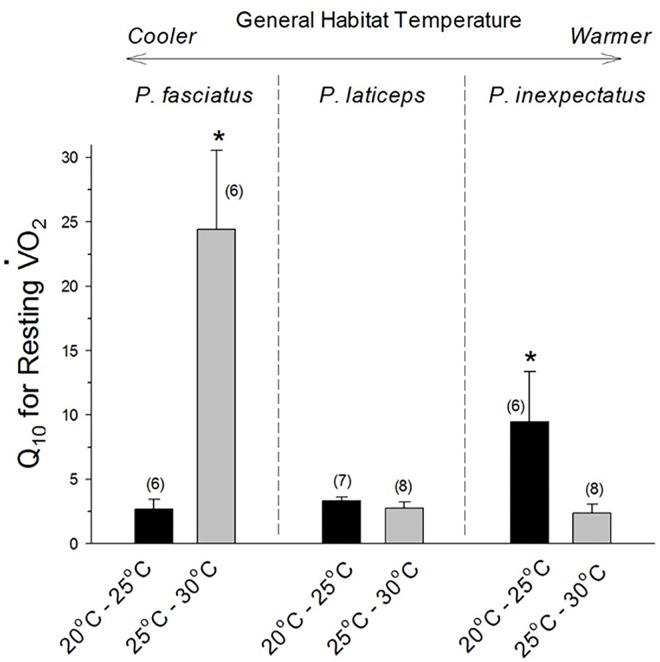
Fig 4. Q10 values for resting oxygen consumption for the scincid lizards Plestiodon fasciatus, Plestiodon inexpectatus, and Plestiodon laticeps.
The placement of each species is relative to the general habitat temperatures, indicated at the top of the graph. Thus, P. fasciatus experiences the coolest temperatures, and P. inexpectatus the warmest. The gray bars show the metabolic response to an increase in temperature from 25°C to 30°C, while the black bars show the metabolic response to a decrease in temperature from 25°C to 20°C. Means ± 1 SE and n (in parentheses) are given. An * indicates significant difference from the other species for Q10 for the temperature interval to the right of the graph.

