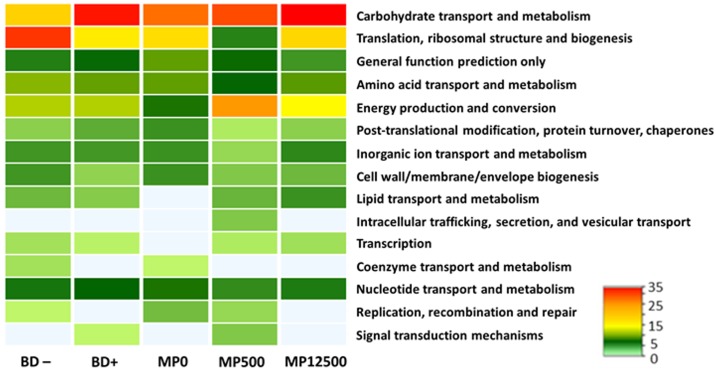
Fig 3. Functional classification of cecal proteins into COG categories.
Heat-Map is drawn on the basis of the relative percentages of the proteins of each statistically different treatment. COG classification of crop samples proteins is available in Figure D in S2 File.

