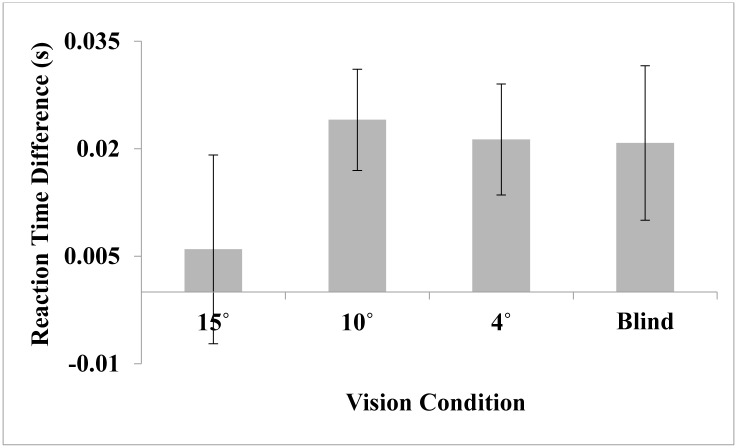
Fig 4. Difference in reaction time between the wide and narrow vision conditions in Experiments 1–4.
The difference score was calculated by subtracting narrow error- wide error for each participant. The average difference for each experiment is plotted. Error bars represent +/- 1 standard error (SE) of the mean.

