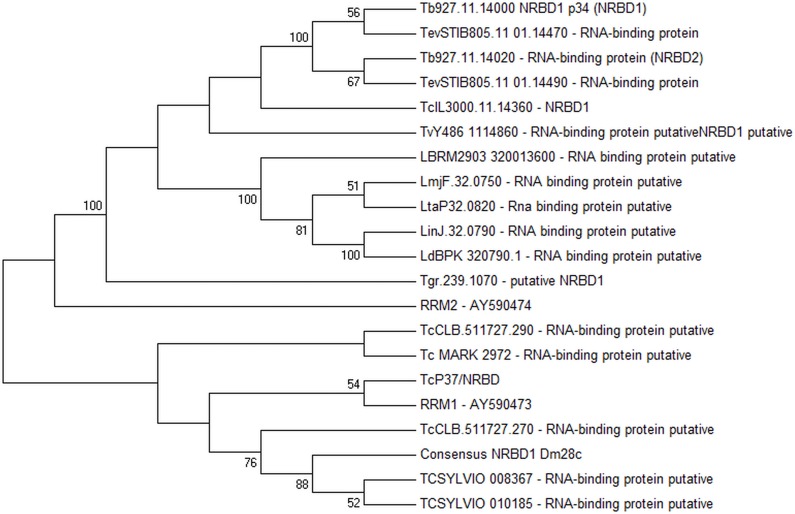
Fig 1. The evolutionary history was inferred using the Maximum Parsimony method.
The bootstrap consensus tree inferred from 1000 replicates is taken to represent the evolutionary history of the taxa analyzed. Branches corresponding to partitions reproduced in less than 50% bootstrap replicates are collapsed. The percentage of replicate trees in which the associated taxa clustered together in the bootstrap test (1000 replicates) are shown next to the branches. The MP tree was obtained using the Subtree-Pruning-Regrafting (SPR) algorithm with search level 1 in which the initial trees were obtained by the random addition of sequences (10 replicates). The analysis involved 21 amino acid sequences. There were a total of 289 positions in the final dataset. Evolutionary analyses were conducted in MEGA7 [34].

