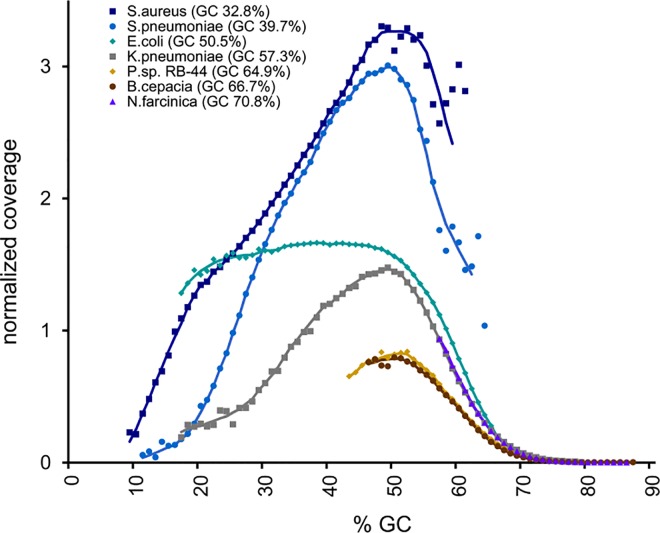
Fig 1. Normalized coverage vs. GC content of seven bacteria.
The sequenced bacteria are: Staphylococcus aureus (dark blue line, 32.8% GC), Streptococcus pneumoniae (light blue line, 39.7% GC), Escherichia coli (teal line, 50.5% GC), Klebsiella pneumoniae (gray line, 57.3% GC), Pandoraea sp. (tan line, 64.9% GC), Burkholderia cepacia (brown line, 66.7% GC), and Nocardia farcinica (purple line, 70.8% GC). Equal amounts of DNA from each bacterium were sequenced and mapped to their respective genome references. The normalized coverage was calculated for each GC percentage point based on the proportion of the number of reads mapped to 100 bp genome windows having this GC content to the number of such windows. These values were normalized by the proportion of the number of all mapped reads to the number of all windows for a given genome.

