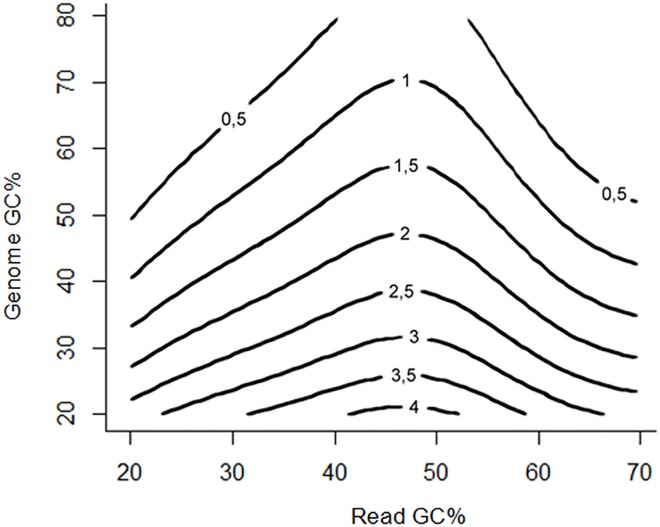
Fig 2. Contour plot of the proposed GC normalization model.
The model approximates expected normalized coverage of genomic regions stratified by their GC content for bacterial genomes of various overall GC content in a pooled whole-metagenome shotgun sequencing sample. Generally, the regions higher than the contour line of value 1 are overrepresented and the regions lower than this line are underrepresented. To perform the GC normalization, each binned read in a metagenomic sample should be divided by the normalized coverage value predicted based on its GC content and the content of the genome to which it mapped.

