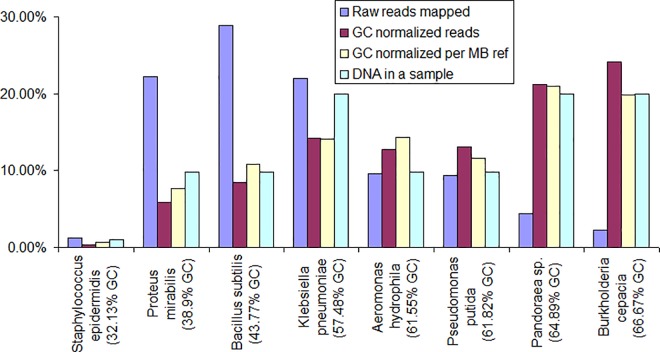
Fig 3. Estimated relative abundances (Experiment 1).
Abundance of each bacterium in the experiment is represented by four bars. The first (left) bar is abundance estimated by raw reads mapped to the genomic reference. The second bar is abundance corrected for GC bias. The third bar is the GC-bias-corrected abundance per Mb of reference. The forth bar is the actual abundance based on the amount of DNA in the pooled sample. In most cases the corrected values follow the actual values much closer than those based on raw reads.

