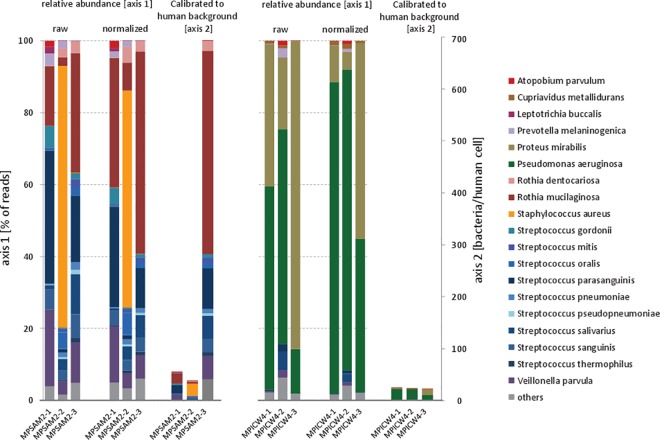
Fig 4. Relative bacterial abundances and bacterial abundances per human cell in upper airways of two cystic fibrosis patients measured at three time points.
The two bar charts represent bacterial abundance estimates in sputa sampled from two subjects with cystic fibrosis (CF) who are homozygous for the p.Phe508del mutation in the CFTR gene. Each chart contains three sets of three bars, where the bars in each set represent three samples which were taken in 3-month intervals. The first two sets represent relative abundances based on raw read counts (first set) or based on GC and genome length normalized counts (second set). The third set of bars shows bacterial abundances per human cell based on the normalized counts in the second set calibrated to human background. The patient on the left (MPSAM2) has significantly increased absolute bacterial abundance (per human cell) in the third sample, which is not obvious from the relative abundance histograms.

