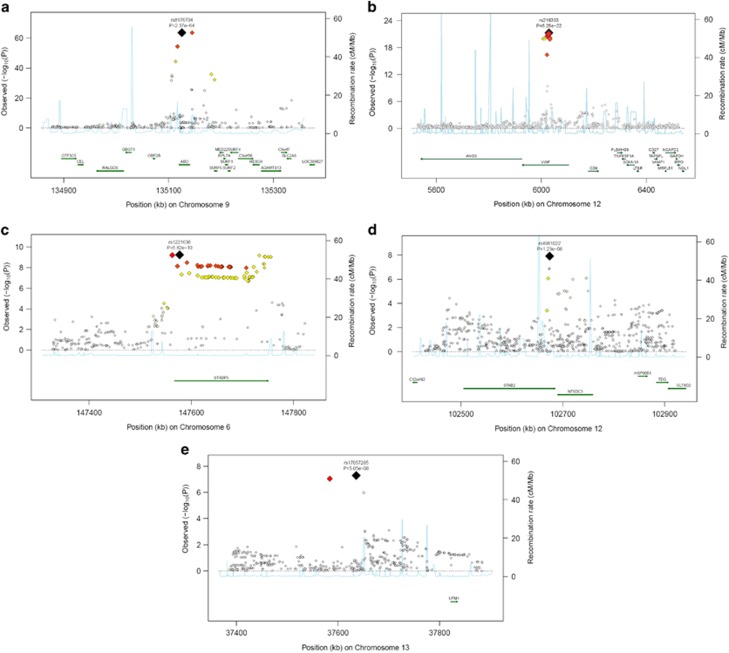
Figure 3.
Regional plots of top marker loci associated with low VWF levels. (A–E) The association P-values (−log10 transformed, indicated by the left y axis) for SNPs in a 60-kb region of each of the five loci (ABO, VWF, STXBP5, STX2, UFM1) are plotted against their chromosome positions (NCBI build 3) on x axis. The top SNPs are presented as a large diamond in red font and neighboring variants are presented in different colors based on linkage disequilibrium based on HapMap Caucasian data: red: 1≤r2>0.8; orange: 0.8≥r2>0.6; yellow: 0.6≥r2>0.3; green: 0.3≥r2>0.1; blue: 0.1≥r2>0.05; light blue: 0.05≥r2>0.0. The left y axis is the P-value on the −log10 P-value scale and the gray line marks the threshold of genome-wide significance (P=5 × 10⁻⁸). Shown in light blue are the estimated recombination rates in HapMap with values indicated by the right y axis. Regional genes and their direction of transcription are depicted with green arrows. The full colour version of this figure is available at EJHG Journal online.

