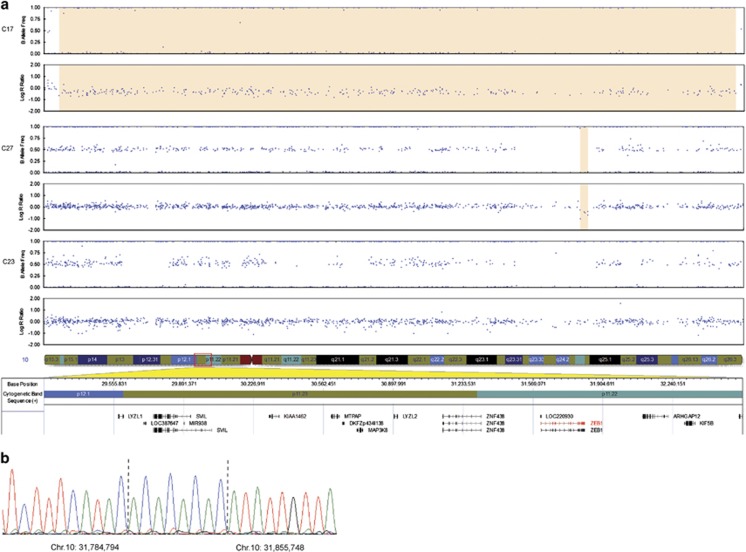
Figure 2.
SNP array CNV analysis of the ZEB1 region in probands with PPCD. (a) A heterozygous ~3.3-Mb deletion was detected in individual III:1 from family C17 (top two traces, highlighted region) and a putative deletion in the ZEB1 genomic region in proband C27 (third and fourth traces, highlighted region). No CNV was identified in proband C23. Blue dots represent individual array probes. The horizontal axis indicates genomic position of array probes and the vertical axis indicates the allele frequency (top trace for each individual) or log R ratio (bottom trace for each individual). The genomic region is shown below the SNP array data. (b) Long-range PCR across the deletion breakpoints and subsequent Sanger sequencing (proband C27) revealed chr10.hg19:g.31,784,795_31,855,747delinsACACACAC. The inserted sequence is shown between the dotted lines. A full colour version of this figure is available at the European Journal of Human Genetics journal online.

