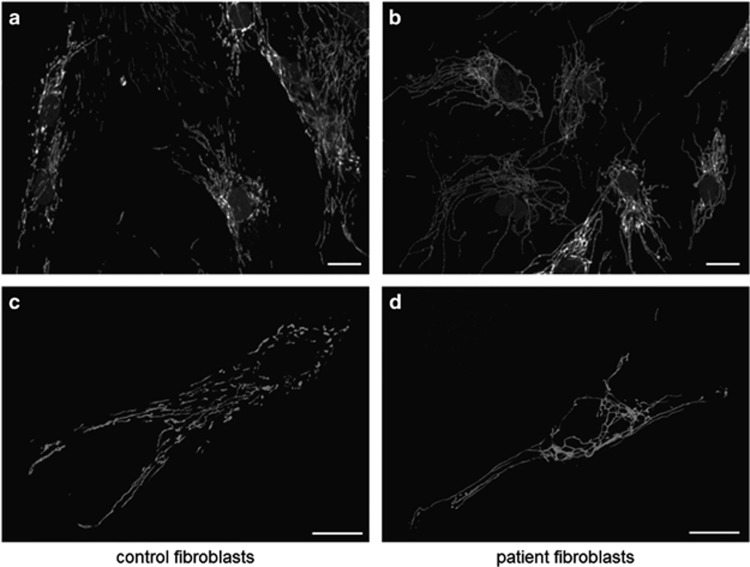
Figure 2.
Patient fibroblasts exhibit a hyperfused mitochondrial network morphology. TOMM20-stained fibroblasts from (a) control and (b) patient with hyperfused mitochondrial network. Representative single cell from live cell imaging of MitoTracker Green FM-stained (c) control and (d) patient with hyperfused mitochondrial network. Scale bar=25 μm.

