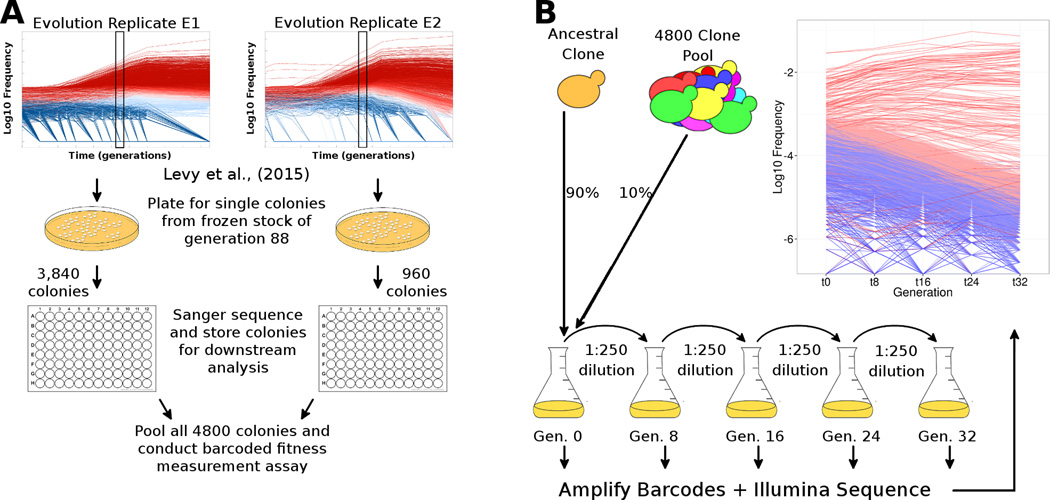
Figure 1. Experimental procedures to select and measure fitness of evolved clones.
(A) Schematic of isolation and identification of individual evolved yeast clones. We isolated 4,800 single colonies from generation 88 across both replicate evolution experiments from Levy et al. (2015), determined their lineage barcodes, and stored them individually. (B) Schematic of barcoded fitness measurement assay. We grew all 4,800 colonies individually (not shown) and pooled them. The pool was mixed with an ancestral clone at a 1:9 ratio and the mixture was propagated for 32 generations in four independent batches (2–3 replicates per batch). At each transfer (every 8 generations), we isolated DNA, amplified the barcodes and conducted high-throughput sequencing to estimate the frequency trajectory of each barcode. The inset graph shows the frequency trajectory of all lineages with fitness > −1%, where adaptive lineages are colored in red (darker red lineages are more fit) and neutral lineages are colored in blue. Fitness was estimated using 24 generations of data from these frequency trajectories (M&R). Raw data for the sampled clones and their fitness measurements are in Tables S1–S3.

