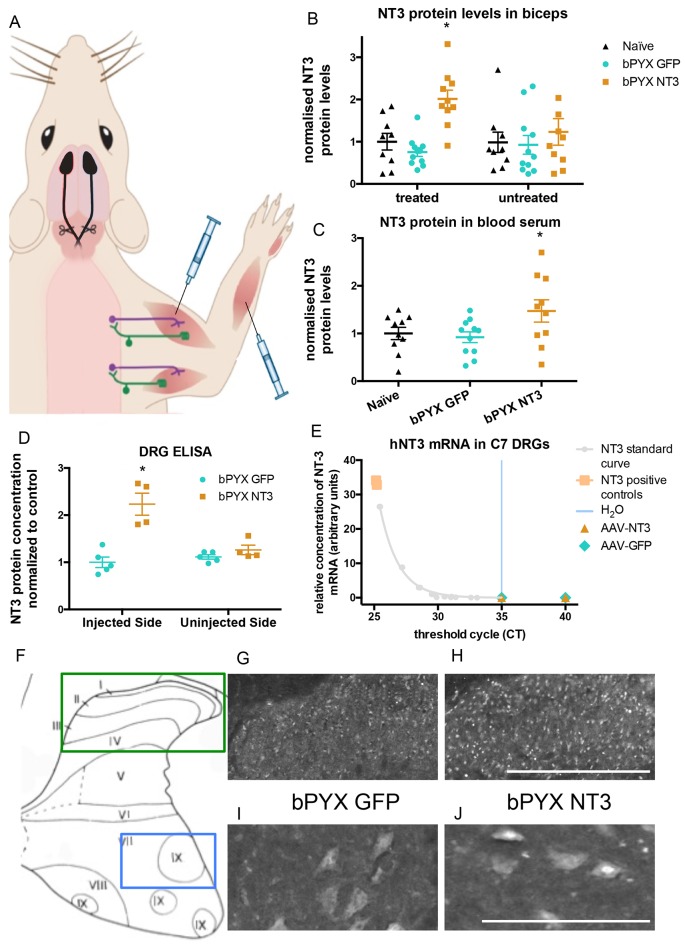
Figure 2. Increased levels of neurotrophin-3 in muscle and blood post-injection of AAV1 neurotrophin-3 into forelimb muscles.
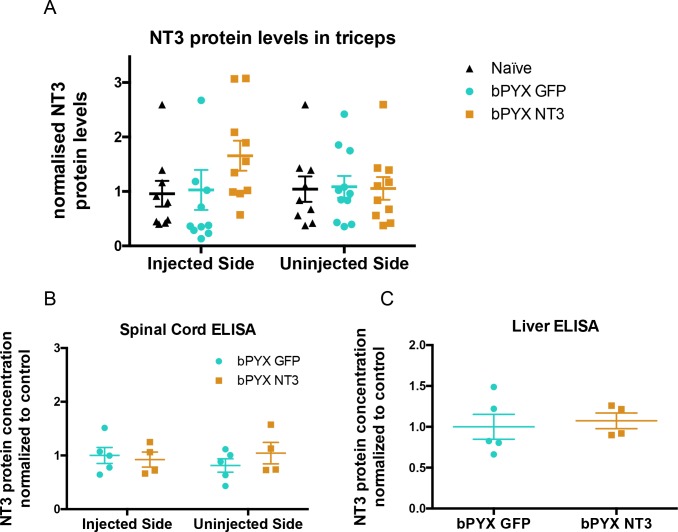
(A) Schematic showing experimental set-up. Rats received bilateral pyramidotomies and were injected either AAV1-NT3 or AAV1-GFP into forelimb muscles. The monosynaptic proprioceptive reflexes are shown. Group Ia afferents project from the muscle via their cell bodies in the DRG into the spinal cord. Motor neurons project to the muscles. (B) ELISAs confirmed that neurotrophin-3 is upregulated in the biceps brachii 10 weeks post-injection with AAV1-NT3 (n = 10/11 per group, RM two-way ANOVA, group F = 7.2, p = 0.003, post-hoc analysis revealed an increase only on the injected side of the bPYX NT3 group versus naïve or bPYX GFP, p-values<0.05). (C) The Neurotrophin-3 level in the blood serum was also increased after AAV1 NT-3 treatment (one-way ANOVA, F-value = 3.4, p=0.047, bPYX NT3 versus naïve or bPYX GFP, p-values<0.05). (D) A separate cohort of rats was injected with either AAV1-GFP or AAV1-NT3 into forelimb muscles. ELISAs of C3 to C8 DRGs showed a 2.3 fold increase of NT3 only in DRGs from the side ipsilateral 4 weeks after injections (n = 4/5 per group, one-way ANOVA, F = 34.13, p<0.001, AAV-NT3 injected side versus all other groups, p-values<0.05). (E) qRT-PCR for human NT-3 mRNA confirms that the viral vector is not transported retrogradely to the DRG. Human neurotrophin-3 mRNA was detected in positive control samples (human brain cDNA) and in the standard curve but not detected in the ipsilateral (left) DRGs at 4 weeks after injection of AAV-NT3 or AAV-GFP (n = 5 per group). The x-axis shows the cycle at which signal rose above background threshold (CT) versus the y-axis which shows the concentration of human NT-3 cDNA with a standard curve plotted through points of the standard. Samples from AAV-NT3 and AAV-GFP groups had CT values ≥35 (comparable to water as No Template Control), indicating absence of human NT-3 mRNA in those samples. (F–J) Transverse cervical spinal cord sections were immunostained for NT3. There was increased immunoreactivity in dorsal horn neurons (compare H with G) and in the nuclei of motor neurons in laminae XI (compare J with I) in the AAV-NT3 group versus AAV-GFP group although we did not detect increased levels of NT3 protein in the spinal cord overall, see Figure 2—figure supplement 2. Scale bars 0.5 mm. (B–E) Data are represented as mean ± SEM.


