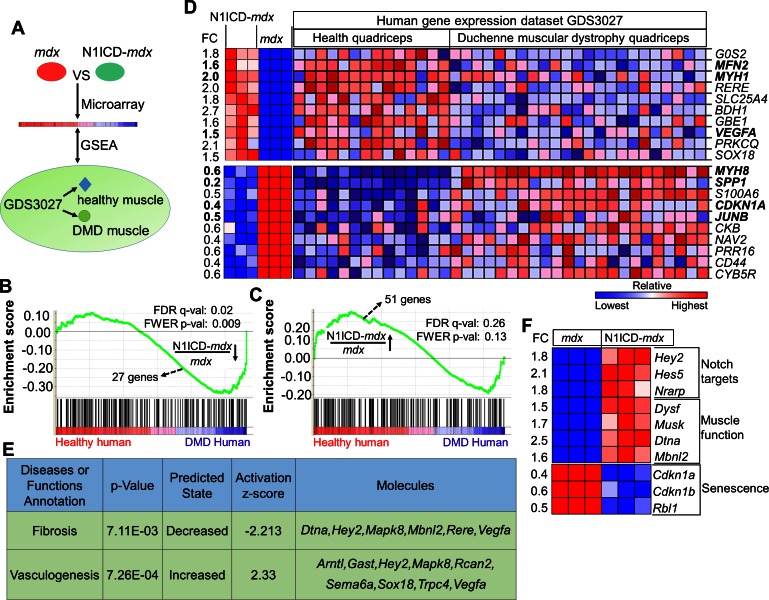
Figure 5. N1ICD-mdx muscle transcriptomes gained gene signatures enriched in healthy versus DMD human muscles.
(A) Cartoon illustration of experiment design for (B–D). (B,C) Gene set enrichment plots from GSEA analysis of the normal human and DMD muscle gene expression database (GDS3027), interrogated with the down-regulated (B) and up-regulated (C) gene sets in N1ICD-mdx versus mdx muscles. FC, fold change. (D) Heatmap results of top 10 commonly up-regulated and down-regulated gene expression in N1ICD-mdx muscles and normal human muscles (GDS3027). (E) Ingenuity analysis of 51 genes that are commonly up-regulated in N1ICD-mdx muscles and normal human muscles (GDS3027). (F) Heatmap results of gene expression in the indicated pathways. FC, fold change in N1ICD-mdx relative to mdx muscles.
DOI: http://dx.doi.org/10.7554/eLife.17355.012


