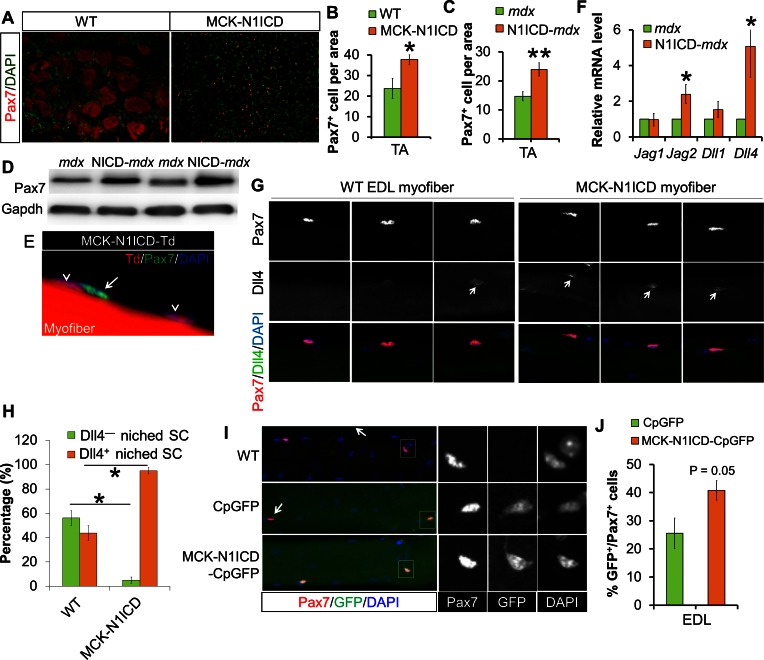
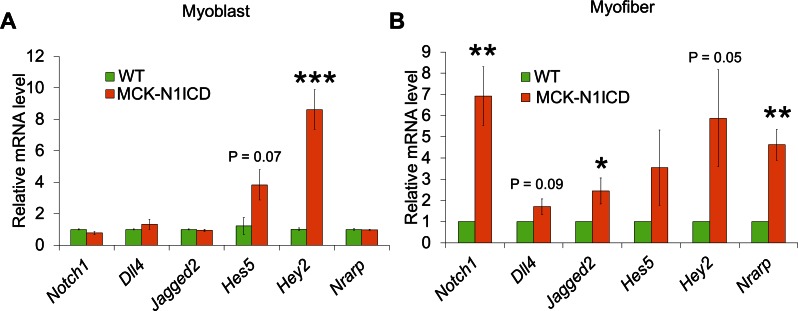
Figure 6. Notch activation in myofiber upregulates Notch ligands’ expression, therefore stimulates Notch-activation and self-renewal of satellite cells niched on MCK-N1ICD myofibers.
(A–C) Immunofluorescence images (A) and quantification of Pax7+ cell numbers in CTX-damaged (B, n = 3) and dystrophic TA muscles (C, n = 7). (D) Western blot results of Pax7 in muscle protein extracts. (E) Immunofluorescence image of one EDL myofiber to show that Pax7 cells are not from MCK-Cre lineage (Td –) of MCK-N1ICD mice. Arrow points to Pax7+/Td– cell, arrow-head points to Pax7–/Td+ myonucleus. (F) Relative mRNA levels of Notch ligand genes. (G,H) Immunofluorescence images (G) and quantification result (H, n = 3) of intact EDL myofibers. Arrow points to Dll4 immuno-signal patch on myofiber. (I,J) Immunofluorescence images (I) and quantification (J, n = 4) of GFP percentage in satellite cells (Pax7) on EDL myofibers. Arrow in I points GFP–/Pax7+ satellite cells; black and white images to shown individual channels of the outlined area on left images. *p<0.05, **p<0.01. Bar graphs indicate mean SEM.


