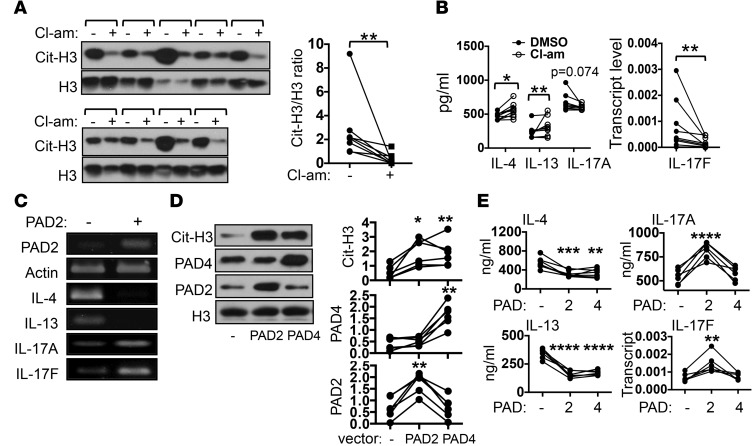
Figure 6. PTPN22 regulates the Th2/Th17 cytokine profile by suppressing citrullination.
(A and B) PBMCs from 9 at-risk individuals were stimulated with anti-CD3 in the presence or absence of Cl-amidine (Cl-am, 50 μM). The level of citrullinated histone H3 (cit-H3) and total histone H3 (H3) was analyzed by Western blotting (A). Each bracket represents one donor. The cit-H3/H3 density ratios from all donors are shown to the right. The levels of indicated cytokines are shown in B. (C) Jurkat cells expressing (+) or not expressing (–) a doxycycline-inducible PAD2 were treated with doxycycline (50 μM) for 12 hours. The transcript levels of indicated genes from 1 of 3 independent experiments are shown. (D and E) Control PBMCs were transfected with an empty vector (–) or a vector expressing PAD2 or PAD4 and then stimulated with anti-CD3. The levels of PAD2, PAD4, cit-H3, and H3 were measured by Western blotting (D). Representative blots from 6 independent experiments and normalized density of PAD2, PAD4, and cit-H3 are shown. The levels of indicated cytokines in the PBMCs are shown in E. Statistical analysis was performed with paired Student’s 2-tailed t test (A and B) or 1-way ANOVA using empty vector–transfected groups as controls (D and E). *P < 0.05; **P < 0.01; ***P < 0.001; ****P < 0.0001.

