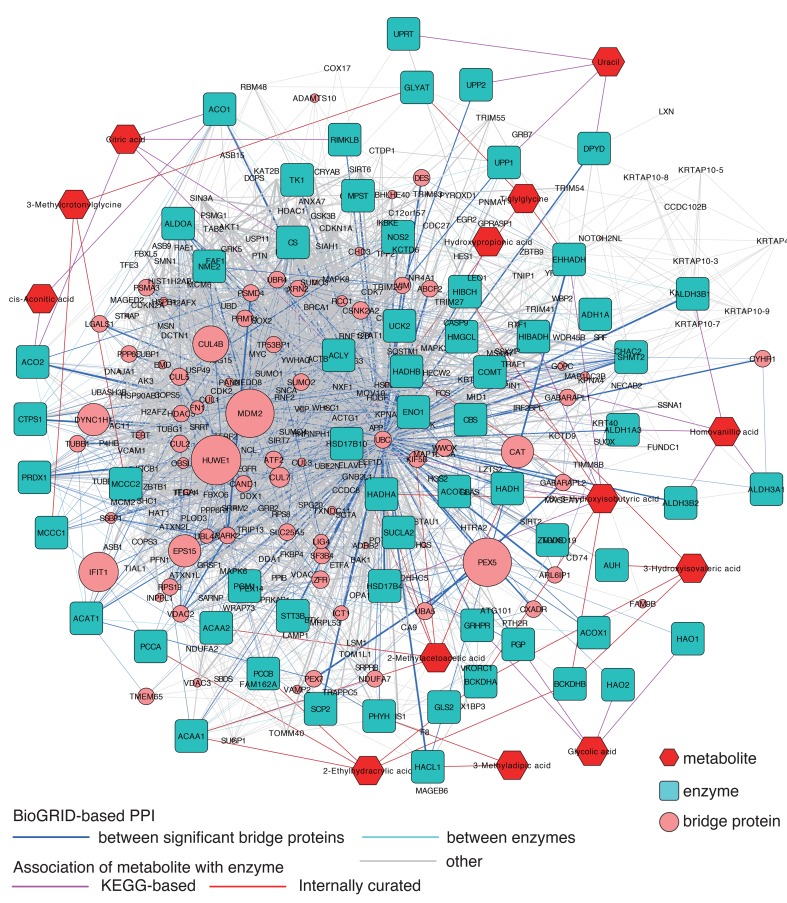
Figure 1. Metabolite protein-protein interaction network (MetBridgeDKD) connecting 13 metabolites that were significantly decreased in diabetic kidney disease samples.
Red, blue, and pink nodes represent metabolites, enzymes, and bridge proteins, respectively. Pink, red, and blue edges represent KEGG-based associations of metabolite with enzyme, internally curated associations of metabolite with enzyme, and BioGRID-based protein-protein interaction (PPIs), respectively. The network was created using our internally developed MetBridge Generator, which runs as an App on Cytoscape. Node sizes of the bridge proteins (pink) are proportional to significance of node degree. Edge widths of PPIs are proportional to number of articles reporting the corresponding interactions.

