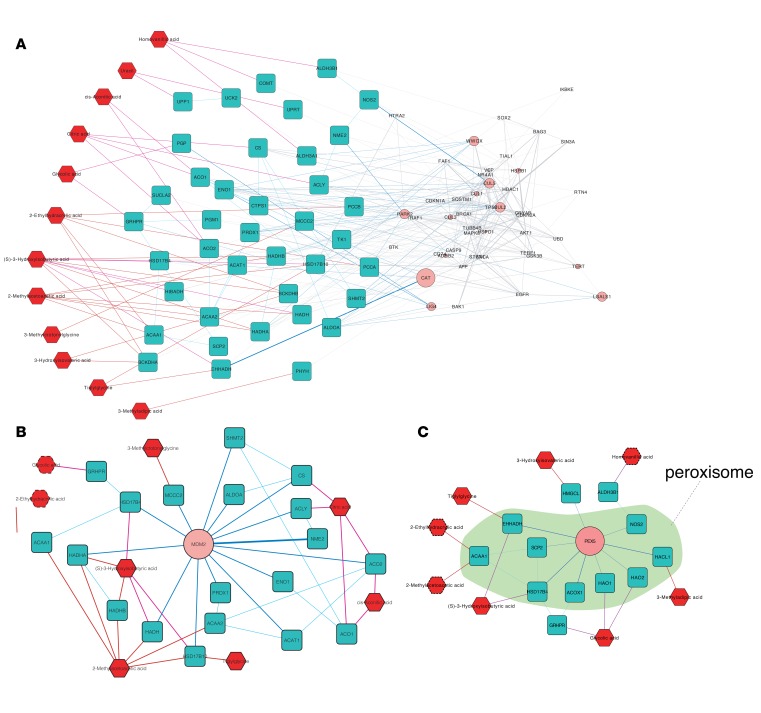
Figure 2. Subnetworks connecting part of 13 metabolites significantly decreased in diabetic kidney disease samples.
(A) Subnetwork showing enzymes (blue rectangles) associated with bridge proteins (pink circles) that are known to have a function in apoptosis, and the metabolites (red hexagons) associated with these enzymes. (B) Subnetwork showing enzymes that interact with MDM2 (bridge protein) and metabolites that are associated with these enzymes. Six metabolites (solid red hexagons) are associated with the enzymes that directly interact with MDM2. Two metabolites (dotted red hexagons) are associated with the enzymes that interact with MDM2-interacting enzymes. (C) Subnetwork showing enzymes that interact with PEX5 (bridge protein) and metabolites that are associated with these enzymes. Peroxisomal components are marked in green. Five metabolites (solid red hexagons) are associated with the enzymes that directly interact with PEX5. Three metabolites (dotted red hexagons) are associated with the enzymes that interact with PEX5-interacting enzymes.

