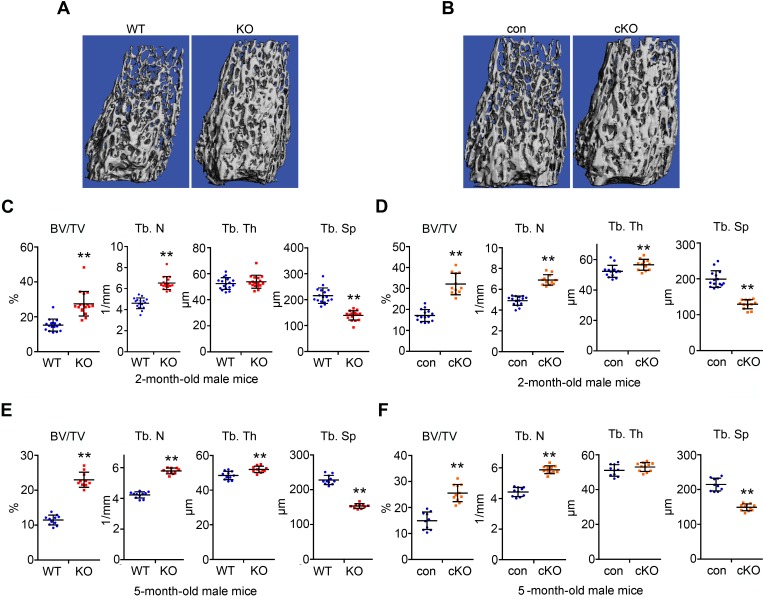
Figure 2. Plekhm1 germline and conditional deletion male mice have increased trabecular bone mass at 2- and 5-month-old of age.
(A and C) μ-CT images and analyses of the trabecular bone compartment of the distal femurs of 2-month-old male wild-type and germline deletion (KO) mice (n = 17). (B and D) μ-CT images and analyses of the trabecular bone compartment of the distal femurs of 2-month-old male control (con) and Plekhm1 conditional deletion (cKO) mice (con, n = 15; cKO, n = 12). (E and F) μ-CT analyses of the trabecular bone compartment of the distal femurs of 5-month-old male mice (WT, n = 11; KO, n = 10; con, n = 10; cKO, n = 11). BV/TV, percentage of trabecular bone volume to tissue volume; Tb. N, trabecular number; Tb. Th, trabecular thickness; Tb.Sp, trabecular separation. Data in C–F are presented as scatter dot plots. The mean and SD of each group are overlaid to each column of dots. **P < 0.01 versus WT or con by Student’s t test.

