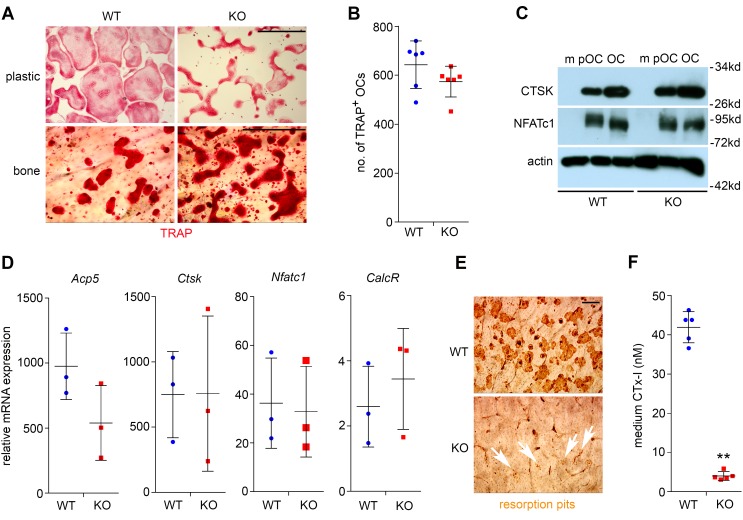
Figure 4. Loss of Plekhm1 attenuates bone resorption without affecting osteoclast differentiation.
(A) Tartrate-resistant acid phosphatase (TRAP) staining of wild-type and Plekhm1–/– (KO) osteoclasts cultured on plastic dishes and bovine cortical bone slices. Representative images are from 6 samples/group/culture of 3 independent cultures from different mice. Scale bar: 200 μm. (B) Number of TRAP+ osteoclasts with more than 3 nuclei/well of a 48-well plate (n = 6). (C) Protein expression of osteoclast markers, cathepsin K (CTSK) and nuclear factor of activated T cells, cytoplasmic 1 (NFATc1), as detected by Western blotting during osteoclast differentiation. Actin served as a loading control. m, bone marrow monocytes; pOC, preosteoclasts; OC, mature osteoclasts. The experiment was repeated 3 times. (D) mRNA expression of osteoclast marker genes, Acp5 (also known as TRAP), Ctsk, Nfactc1, calcitonin receptor (CalcR), in mature osteoclasts, as measured by quantitative real-time PCR (n = 3). (E) Resorption pit staining of WT and KO osteoclasts cultured on bone slices. White arrows point out the tiny pits dug by KO osteoclasts. Each image is a representative of 6 bone slices/group/culture of at least 3 independent cultures from different mice. Scale bar: 40 μm. (F) The amount of medium CTx-I, collagen fragments released by osteoclasts during bone resorption, was measured by ELISA (n = 5). **P < 0.01 versus WT by Student t test. Data in B, D, and F are presented as scatter dot plots. The mean and SD of each group are overlaid onto each column of dots.

