Figure 1.
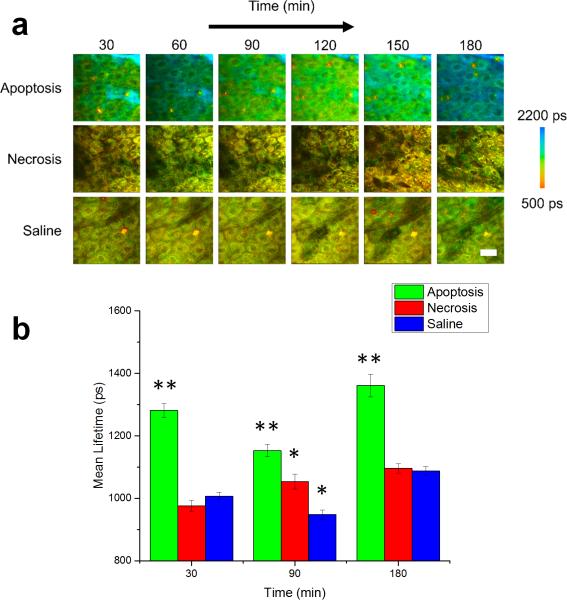
In vivo mean fluorescence lifetime dynamics in murine keratinocytes. (a) Images of the mean lifetime tracked between 30-180 minutes following treatment for inducing apoptosis or necrosis in epidermal keratinocytes. Saline-treated mice were used as a control. (b) Comparison of the mean lifetime (τm) in cells across the observed experimental population 30, 90 and 180 minutes after the treatment. At each time point, N = 34 cells analyzed for the apoptosis group, N = 14 cells analyzed for the saline group and N = 23 cells analyzed for the necrosis group. * p < 0.05, ** p < 0.01 compared to the other two groups. Scale bar is 25 μm. All error bars represent SEM.

