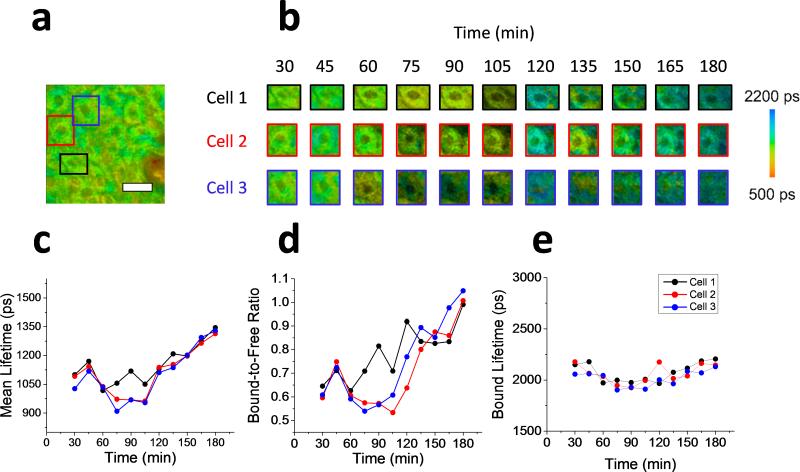
Figure 4.
Single cell analysis of in vivo apoptotic keratinocytes. (a) Mean fluorescence lifetime image of the full field of view of the microscope of in vivo mouse skin treated with apoptosis-inducing compound. The three colored rectangles represent the image regions were individual cells were studied. (b) Longitudinal tracking of the mean lifetime from three cellular regions. Images are shown for each cell every 15 minutes up to three hours following the treatment. (c-e) Plots of the metabolic lifetime parameters of the three cells studied including the mean lifetime (c), bound-to-free NADH ratio (d), and bound lifetime (e). Scale bar is 25 μm.

