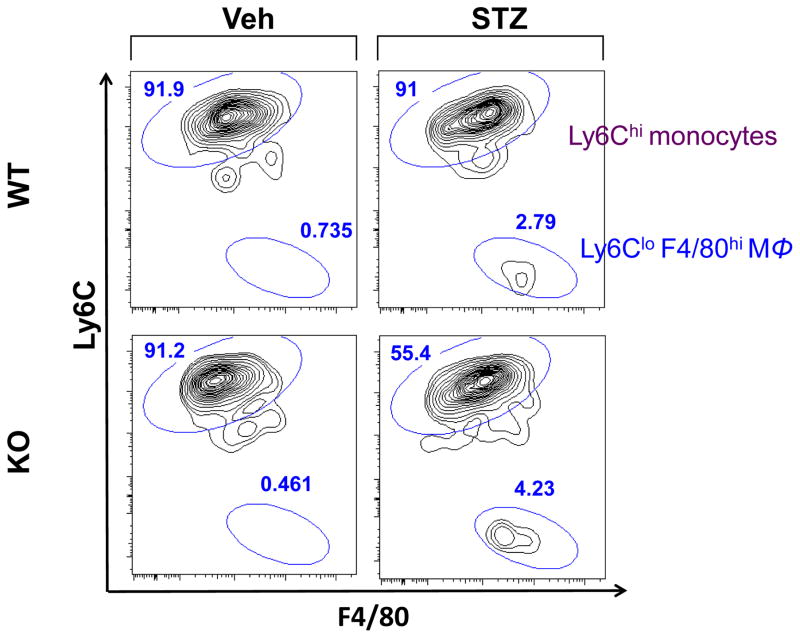
Figure 3. Macrophage infiltration in the retina.
Flow cytometry diagrams from n = 8 pooled retinas from Veh-WT, Veh-KO, STZ-WT and STZ KO mice. Gating strategy is described in Supplemental Fig. 1. Flow diagrams show: [live singlets/Ly6G-/CD45hi/F4/80+/− mononuclear cells.

