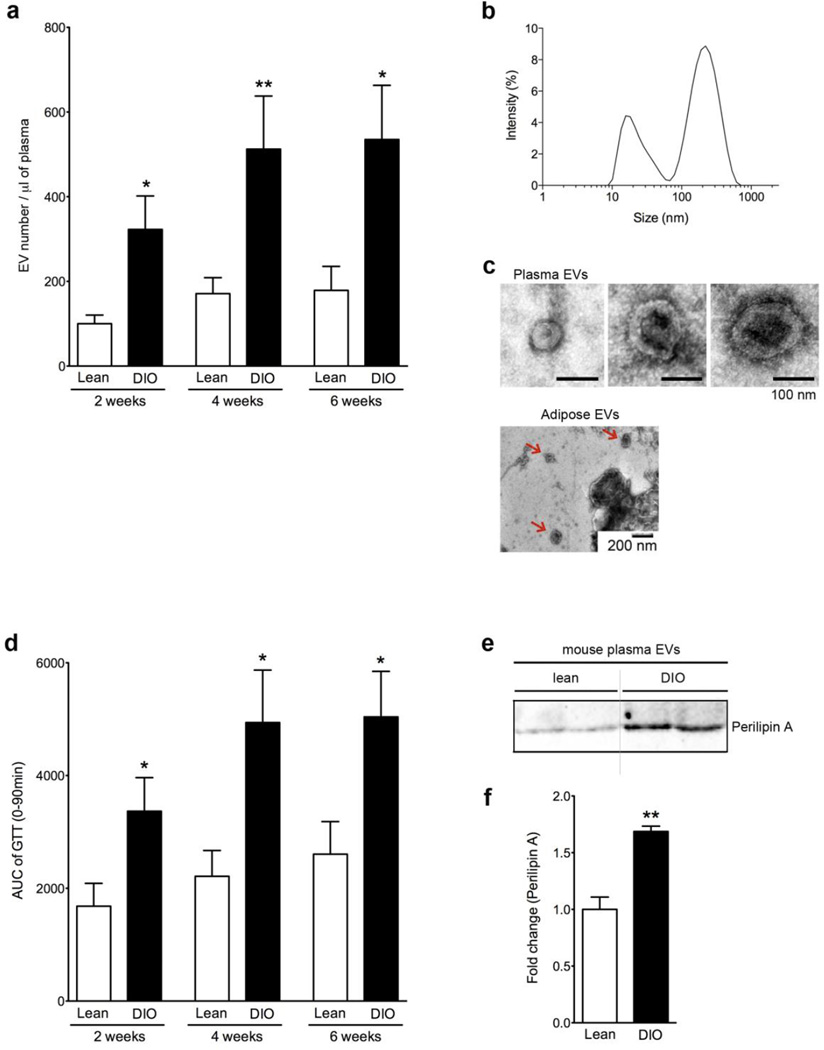
Figure 2. Obesity is associated with increased levels of circulating EVs associated with insulin resistant and macrophage infiltration.
(a) The number circulating EVs from lean (chow diet-fed) and DIO (HF diet-fed) mice at 2, 4, and 6 weeks assessed via flow cytometry. (n=10 each group). (b,c) Characterization of circulating EVs and AT lysate-EVs. (b) The size of isolated circulating EVs from DIO mice via dynamic light scattering analysis. (c) Transmission electron microscopy of isolated circulating EVs from DIO mice and AT lysate. (d) Area under the curve (AUC) of GTT assay from lean and DIO mice at 2, 4, and 6 weeks. (e) Western blot analysis of perilipin A levels in EVs isolated from lean and DIO mice at 6 weeks. (f) Quantification of perilipin A level. *p < 0.05; **p < 0.01.

