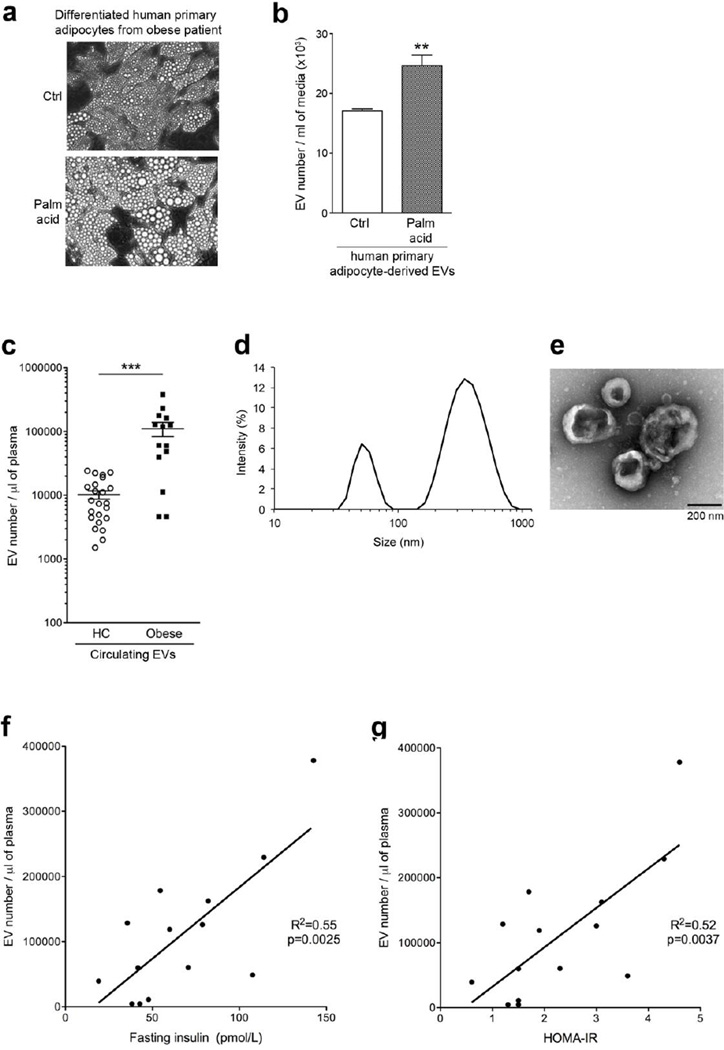
Figure 3. The release of EVs increases in stressed human primary adipocytes and in obese human plasma correlating to plasma insulin and HOMA-IR.
(a) Morphology of human primary adipocytes differentiated in vitro from pre-adipocytes treated with control or 0.5 mM palmitic acid. (b) Number of human primary adipocyte-derived EVs assessed by flow cytometry. Values represent mean ± S.D. Palm acid, palmitic acid. (c) The number of EVs from HC (healthy individual control) and obese measured by flow cytometry. (d, e) Characterization of circulating EVs. (d) The size of isolated circulating EVs from obese subjects as assessed by dynamic light scattering analysis. (e) Transmission electron microscopy of isolated circulating EVs from obese subjects. (f, g) Circulating EV number correlated to: (f) fasting plasma insulin concentration and (g) HOMA-IR value. **p < 0.01; ***p < 0.001.

