Introduction
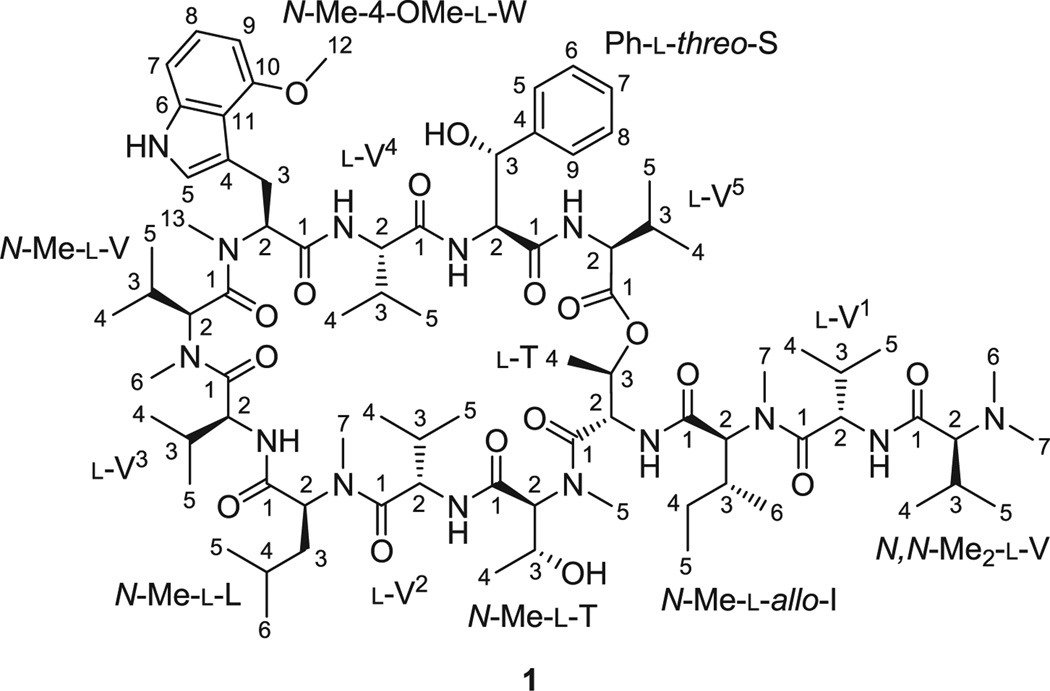
Ecumicin (1) is a drug lead compound that was recently discovered as part of a high-throughput screening campaign for new narrow spectrum anti-tuberculosis (TB) agents from an extensive actinomycete extract library.[1] As a macrocyclic tridecapeptide, 1 exerts its potent bactericidal activity by targeting the mycobacterial hexameric chaperon protein, ClpC1.[2] This represents a new anti-TB drug target that is not shared by any current TB drug and explains why 1 is effective in vitro, and potentially in vivo, for the treatment of even drug-resistant TB (Fig. 1).[2]
Figure 1.
The structure of ecumicin (1).
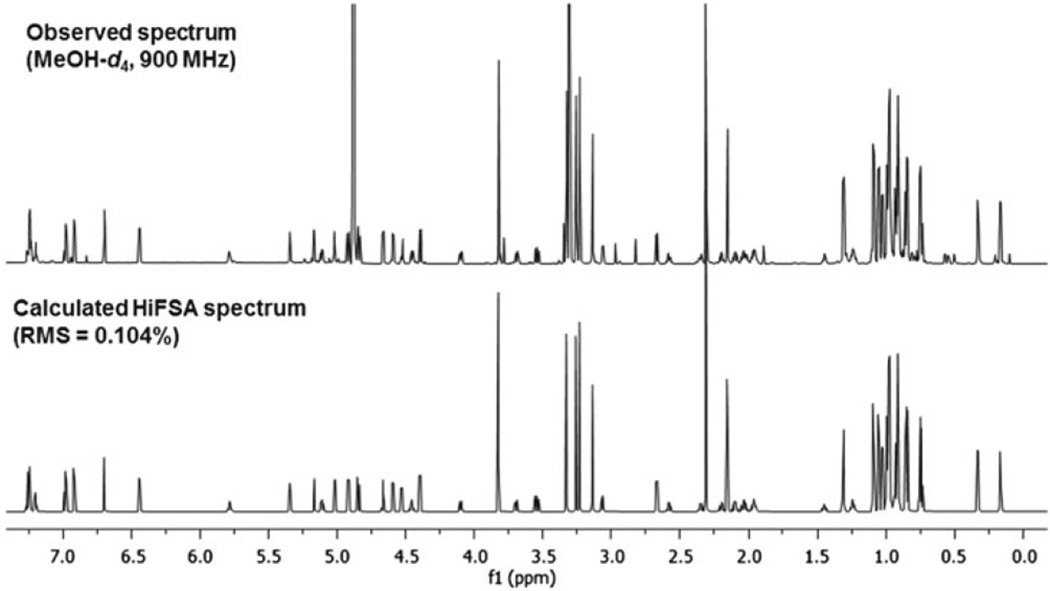
With a molecular formula of C83H134N14O17, the 1D 1H NMR spectrum of ecumicin is rather complex. Even when using a protic NMR solvent, methanol-d4, and acquiring the spectrum with an ultra-high-field instrumentation (900 MHz), dispersion remains intrinsically limited, preventing full interpretation of the complex resonance patterns. As a result, even careful visual analysis restricted the reporting of 13 proton signals as multiplets and three as broad singlets (Fig. 2).[1]
Figure 2.
Result of the 1H iterative full spin analysis (HiFSA) of the 900 MHz 1H spectrum of ecumicin (1) (experimental vs. simulated spectrum).
In the present work, complete 1H NMR assignments of 1 were achieved by means of 1H iterative full spin analysis (HiFSA).[3] Using the iterator of the PERCH NMR software (PERCH Solutions Inc., Kuopio, Finland) tool, this led to the complete and accurate determination of all chemical shifts (δH), 1H,1H spin–spin coupling constants (JHH), and experimental line widths, thus greatly complementing conventional NMR data examination.[4] This uniquely comprehensive 1H spin information can serve as a basis for all subsequent NMR-based studies of 1 and its analogues. Importantly, the data can be adapted across all available NMR field strengths. In addition, this information facilitates quantitative NMR analyses of these compounds, e.g. for pre-clinical drug development studies.[3,5]
Results and discussion
The isolation and structure elucidation of 1 (Fig. 1) has recently been reported.[1] Briefly, ecumicin (1) was isolated from the mycelial methanolic extract of Nonomuraea sp. MJM5123 via a fractionation scheme of three sequential steps, guided by assays monitoring the activity against Mycobacterium tuberculosis and toxicity against mammalian cells. Extensive analysis of NMR experiments resulted in two plausible planar structures, and the ambiguity was solved by LC-MS2. The absolute configuration of 1 was determined by Marfey’s analysis, and the structure was ultimately confirmed by X-ray crystallography.[1]
The protic solvent, methanol-d4, was chosen in order to simplify the heavily overlapped 1H NMR spectrum of 1. Although the use of an aprotic NMR solvent such as DMSO-d6 would provide information about the exchangeable protons and, thus, the amino acid sequence, the combination of a protic NMR solvent and an HMBC experiment is equally capable of uncovering the sequence information. In addition, in aprotic NMR solvents, the exchangeable amide protons tend to give rise to broad signals, which may overlap with side chain 1H signals and complicate the NMR spectrum further; in contrast, aprotic solvents usually yield sharper 1H NMR signals.
It was likely that a molecule’s conformation in solution differs from that in its crystalline form. To explore potential differences, molecular modeling calculations were performed. However, the resulting structure was similar to the X-ray structure of 1 (Supporting Information), suggesting that the conformation of ecumicin is relatively rigid, with the main flexibility involving the three amino acid tail. Although the ACA graphical user interface of the PERCH NMR software has been successfully used to analyze the 1H NMR spectra of many molecules in a semi-automated or fully automated manner, including the nonapeptide atosiban,[6] it was not possible to analyze the NMR spectrum of 1 in an unattended process. This may be in part due to the large number of nuclei that must be simultaneously assessed, which increases dramatically the number of potential solutions to be evaluated by the iteration software. Moreover, the presence of multiple structural moieties with identical coupling patterns and similar chemical shift distributions, such as five l-V residues, augments the chances of misassignment under a fully automatic regime. While the predicted chemical shifts were suitable starting values (Table S1), and more suitable than reported values of free amino acids,[7] manual adjustments of the starting parameters were necessary and required careful examination of the 1D and 2D NMR spectra of 1.[1] The severe signal overlap in the aliphatic region hindered visual analysis the most. Nevertheless, HiFSA was able to deconvolute these signals, thus allowing for a thorough interpretation of all overlapped resonances. As a result, accurate δH and JHH values were obtained for all protons (Tables 1 and 2), including those which previously were reported as overlapped ‘multiplets’.
Table 1.
Final HiFSA-based 1H chemical shifts (δH, in ppm) and multiplicities of ecumicin (1)
| Amino acid |
Position | δH (ppm) |
Multiplicity | Amino acid | Position | δH (ppm) |
Multiplicity |
|---|---|---|---|---|---|---|---|
| N,N-Me2-l-V | 2 | 2.672 | d | l-V3 | 2 | 4.594 | d |
| 3a | 2.042 | dqq | 3a | 2.027 | dqq | ||
| 4 | 0.847 | d | 4 | 0.915 | d | ||
| 5 | 0.978 | d | 5 | 0.859 | d | ||
| 6,7 (N,N-Me2) | 2.313 | s | |||||
| N-Me-l-V | 2 | 3.065 | d | ||||
| l-V1 | 2 | 4.669 | d | 3a | 2.583 | dqq | |
| 3a | 2.101 | dqq | 4 | 1.094 | d | ||
| 4 | 0.992 | d | 5 | 0.976 | d | ||
| 5 | 1.055 | d | 6 (N-Me) | 3.140 | s | ||
| N-Me-l-allo-I | 2 | 4.918 | d | N-Me-4-OMe-l-W | 2 | 4.102 | d |
| 3a | 1.957 | dddq | 3a | 3.545 | dd | ||
| 4aa | 0.989 | ddq | 3b | 3.694 | dd | ||
| 4ba | 1.246 | ddq | 5b | 6.698 | d | ||
| 5 | 0.754 | dd | 7c | 6.918 | ddd | ||
| 6 | 0.744 | d | 8 | 6.984 | dd | ||
| 7 (N-Me) | 3.234 | s | 9 | 6.442 | dd | ||
| 12 (O-Me) | 3.826 | s | |||||
| l-T | 2 | 5.167 | d | 13 (N-Me) | 2.157 | s | |
| 3 | 5.783 | dq | |||||
| 4 | 1.313 | d | l-V4 | 2 | 4.529 | d | |
| 3a | 2.200 | dqq | |||||
| N-Me-l-T | 2 | 5.018 | d | 4 | 1.028 | d | |
| 3 | 4.457 | dq | 5 | 0.989 | d | ||
| 4 | 0.912 | d | |||||
| 5 (N-Me) | 3.330 | s | Ph-l-threo-S | 2 | 4.854 | d | |
| 3 | 5.344 | d | |||||
| l-V2 | 2 | 4.842 | d | 5 (o)b | 7.240 | dddd | |
| 3a | 2.350 | dqq | 6 (m)b | 7.255 | dddd | ||
| 4 | 1.092 | d | 7 (p)b | 7.201 | dddd | ||
| 5 | 0.979 | d | 8 (m)b | 7.255 | dddd | ||
| 9 (o)b | 7.240 | dddd | |||||
| N-Me-l-L | |||||||
| 2 | 5.110 | d | |||||
| 3aa | 1.453 | ddd | l-V5 | 2 | 4.396 | d | |
| 3ba | 1.239 | ddd | 3a | 1.968 | dqq | ||
| 4a | 0.957 | ddqq | 4 | 0.935 | d | ||
| 5 | 0.168 | d | 5 | 0.919 | d | ||
| 6 | 0.331 | d | |||||
| 7 (N-Me) | 3.259 | s |
Table 2.
HiFSA-based 1H,1H spin–spin coupling constants (JHH, in Hz) of ecumicin (1)
| Amino acid | Coupling | JHH (Hz) | Amino acid | Coupling | JHH (Hz) |
|---|---|---|---|---|---|
| N,N-Me2-l-V | 3J (2,3) | 9.18 | l-V3 | 3J (2,3) | 8.88 |
| 3J (3,4) | 6.59 | 3J (3,4) | 6.55 | ||
| 3J (3,5) | 6.62 | 3J (3,5) | 6.78 | ||
| l-V1 | 3J (2,3) | 8.75 | N-Me-l-V | 3J (2,3) | 7.62 |
| 3J (3,4) | 6.79 | 3J (3,4) | 6.50 | ||
| 3J (3,5) | 6.72 | 3J (3,5) | 6.82 | ||
| N-Me-l-L | 3J (2,3) | 11.23 | N-Me-4-OMe-l-W | 3J (2,3a) | 11.16 |
| 3J (3,4a)a | 1.56 | 3J (2,3b) | 4.71 | ||
| 3J (3,4b)a | 3.32 | 2J (3a,3b) | −13.73 | ||
| 3J (3,6) | 6.63 | 5J (5,7)a | 0.48 | ||
| 2J (4a,4b)a | −12.91 | 4J (7,9)a | 0.67 | ||
| 3J (4a,5) | 7.26 | 3J (8,9) | 7.79 | ||
| 3J (4b,5)a | 7.64 | 3J (7,8) | 8.18 | ||
| l-T | 3J (2,3) | 2.34 | l-V4 | 3J (2,3) | 7.91 |
| 3J (3,4) | 6.51 | 3J (3,4) | 6.75 | ||
| 3J (3,5) | 6.81 | ||||
| N-Me-l-T | 3J (2,3) | 3.73 | |||
| 3J (3,4) | 6.46 | Ph-l-threo-S | 3J (2,3) | 1.90 | |
| 4J [5(o),9(o)]a | 1.33 | ||||
| l-V2 | 3J (2,3) | 8.92 | 3J [5(o),6(m)]a | 7.65 | |
| 3J (3,4) | 6.69 | 3J [8(m),9(o)]a | 7.65 | ||
| 3J (3,5) | 7.01 | 5J [5(o),8(m)]a | 0.76 | ||
| 5J [6(m),9(o)]a | 0.76 | ||||
| N-Me-l-L | 3J (2,3a) | 8.58 | 4J [5(o),7(p)]a | 1.25 | |
| 3J (2,3b) | 6.59 | 4J [7(p),9(o)]a | 1.25 | ||
| 2J (3a,3b)a | −13.56 | 4J [6(m),8(m)]a | 1.71 | ||
| 3J (3a,4)a | 5.44 | 3J [6(m),7(p)]a | 7.47 | ||
| 3J (3b,4)a | 7.99 | 3J [7(p),8(m)]a | 7.47 | ||
| 3J (4,5) | 6.55 | ||||
| 3J (4,6) | 6.59 | l-V5 | 3J (2,3) | 8.90 | |
| 3J (3,4) | 6.83 | ||||
| 3J (3,5) | 6.41 |
Scalar coupling constants that were not reported previously due to extensive resonance overlap.[1]
As the computational process involves the analysis of both the 1H spin network of 1 and the total line shape of the spectrum, HiFSA is capable of identifying signal distortions that occur in higher-order coupled spin systems and can also reproduce the complex signal patterns encountered. As a result of the total line shape fitting, two small 5J (para) couplings within the Ph-l-threo-S residue [H5(o)-H8(m), H6(m)-H9(o)], one 5J coupling between the N-Me-4-OMe-l-W [H5(o) and H7(p)], as well as 4J (-meta) couplings within the Ph-l-threo-S [H5(o)-H9(o), H5(o)-H7(p), H7(p)-H9 (o), and H6(m)-H8(m)] and N-Me-4-OMe-l-W [H7(p)-H9(o)] residues were readily determined. These small couplings completed the J-coupling map of the aromatic spin systems of 1. The three signals, which had to be described previously as ‘broad singlet’ arising from the Ph-l-threo-S residue, could thereby be identified as belonging to an AA′BB′C spin system, with defined multiplicities and JHH values. In addition, the ‘singlet’ nature of the signal associated with the N-Me-4-OMe-l-W residue can now be more accurately described as that of a doublet with a small coupling (JHH = 0.48 Hz).
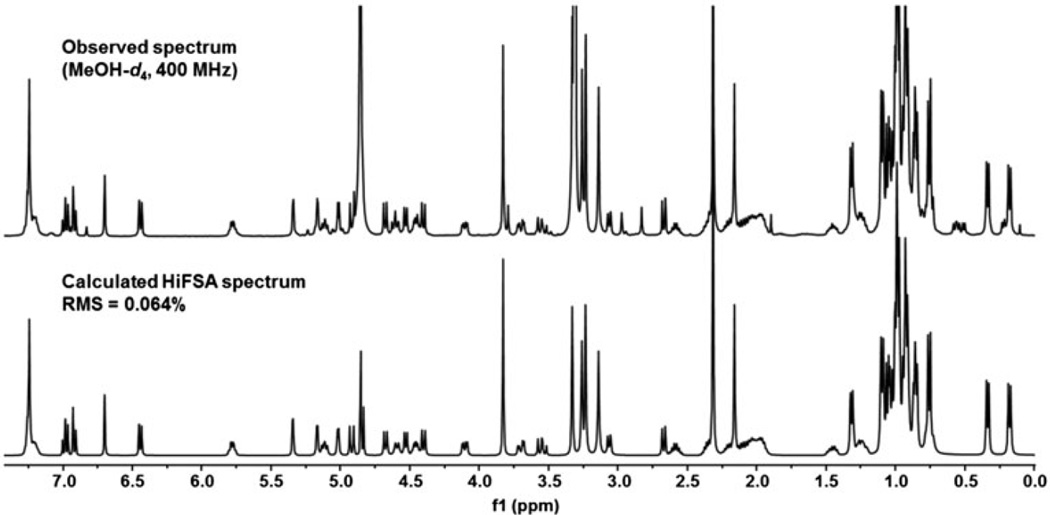
As the HiFSA-generated, numeric 1H NMR profiles consist of the field-independent parameters, δH and JHH, the corresponding high-resolution 1H spectra (HiFSA fingerprints)[6] can be simulated at any desired field strength and used for efficient NMR-based dereplication. To demonstrate the feasibility of this approach, Fig. 3 compares the 1H NMR spectrum of 1 observed at 400 MHz with the simulated 400 MHz spectrum, calculated from the numeric HiFSA profile generated using the 900 MHz 1H spectrum. The simulated HiFSA fingerprint spectrum is in excellent agreement with the lower-field experimental NMR data, displaying a calculated RMS of only 0.064%.
Figure 3.
Result of the 1H iterative full spin analysis (HiFSA) of the 400 MHz 1H NMR spectrum of ecumicin (1) (experimental [top] vs. simulated [bottom] spectrum).
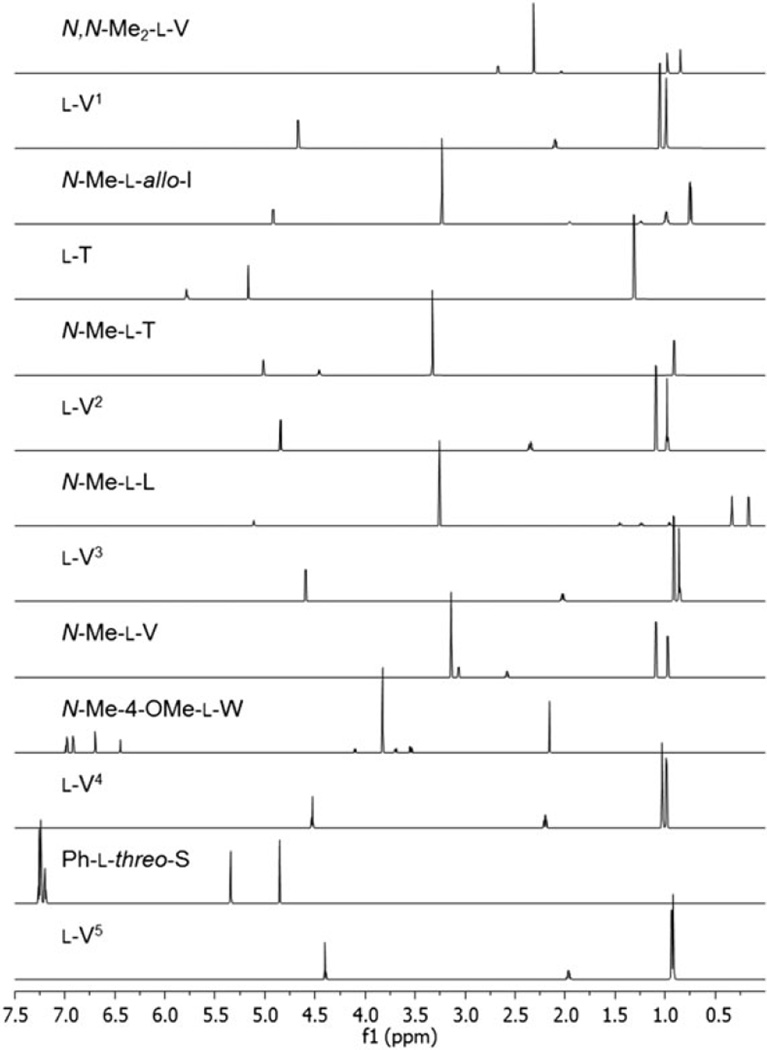
Figure 4 shows sub-spectra of the individual amino acids generated from the ecumicin HiFSA profile. In this fashion, the severely overlapped experimental spectrum of 1 can be represented by the sum of the individual sub-spectra of its 13 amino acid residues. As expected, all l-V residues, including the two N-methylated valines, have very similar individual HiFSA fingerprints: The JHH values are near identical, and the spectra are only subject to small ΔδH effects arising from the different chemical environments within the molecule. This holds true for the two l-T residues (one l-T and one N-Me-l-T) as well. Although a large number of oligopeptides have been reported, the complexity and severe signal overlap in their 1H NMR spectra have mostly resulted in limited information on the coupling pattern of their composing amino acids, whereas HiFSA deduces this information comprehensively as shown here.
Figure 4.
Sub-spectra of the individual amino acid residues of ecumicin (1), extracted from the 1H iterative full spin analysis profile of the entire molecule.
Congruence was observed when comparing the JH,H of l-V, l-T, and l-I of 1 to the available reported JH,H values of these amino acids.[6–11] These observations are consistent with the general assumption that the amino acid residues would essentially maintain their characteristic 1H,1H coupling patterns (JHH values) when present in a different chemical environment, e.g. a different peptide. Based on this observation, we concluded that it should be possible to treat the 1H spectrum of any new peptide as that of a mixture of their individual amino acids. This knowledge, taken together with the HiFSA profiles of individual amino acids, would then greatly assist in the structure elucidation and verification of any new peptide. Furthermore, as HiFSA is able to distinguish between even closely related molecules, as demonstrated recently for four (iso)silybin isomers, which exhibit near-identical 1H NMR spectra,[12] we expect that HiFSA can enable the identification of individual amino acids present in the 1H spectrum of a peptide. Following this approach, the structures of several additional ecumicin-like analogs were elucidated and will be published separately in due course.
By using the simulation tools contained within PERCH and the characteristic parameters summarized in Tables 1 and 2, it is possible to estimate the field strength required to improve the resolution of the 1H NMR spectrum of 1 up to a point at which it essentially becomes a first-order NMR spectrum: A 1H observation frequency of approximately 4 GHz will be necessary to achieve such spectral resolution (Fig. S1). Although such an ultra-high-field instrument would certainly expedite the NMR analysis of small molecules with complex NMR spectra, the required magnetic field strength falls outside of what seems achievable with cryomagnetic technology in the foreseeable future. Until such advance systems can be developed, available tools for computer-aided NMR analysis, such as HiFSA, will continue to provide a means of understanding complex resonance patterns that will otherwise remain undefined.
In summary, possessing a molecular weight of 1599 amu and 138 protons, 1 is presently to our knowledge the largest molecule for which a 1H full spin analysis has been achieved. A list of detailed and accurate δH and JHH values is now available for 1, which permits the generation of the highly reproducible 1H fingerprints of this anti-TB drug lead and its individual amino acid residues, at any field strength including lower-field instruments. Moreover, the HiFSA profiles of individual amino acids from a known peptide can be stored separately in nonproprietary text files (only 2–20 kB in size), and ultimately can assist in the simplification of the structure elucidation process of new peptides. Although a significant component of manual input is at present still required, this new methodology may represent the beginnings of a new paradigm and a valuable adjunct to fully automated NMR-based structure elucidation processes.
Experimental
NMR spectroscopy
A sample of ecumicin (1) was prepared by weighing 4.00 mg (±0.01 mg) into a microcentrifuge tube using a Mettler Toledo XS105 Dual Range analytical balance, followed by addition of 600 µL of methanol-d4 (99.8%). The solution was transferred to a 5 mm NMR tube using a Pressure-Lok gas syringe (VICI Precision Sampling Inc., Baton Rouge, LA, USA). The final concentration of the ecumicin sample was 6.67 mg/ml. After acquiring a 1H NMR spectrum at 400.13 MHz on a Bruker DPX-400 NMR spectrometer equipped with a 5-mm QNP (4-nucleus) probe, the solution was transferred back to a microcentrifuge tube and 200 µL of it was later transferred to a 3 mm NMR tube. A 1H NMR spectrum was also measured at 899.94 MHz with a Bruker AVANCE-II-900 NMR spectrometer, equipped with 5-mm TCI triple resonance inverse detection cryoprobe and z-axis pulse field gradient. All 1H NMR experiments were acquired at 298 K (25 °C) using the standard Bruker pulse sequence (“zg”), with qHNMR parameter optimization. The probes were frequency tuned and impedance matched prior to data collection. Chemical shifts (δH) are expressed in ppm relative to the residual protonated solvent signal (1H 3.310 ppm), and coupling constants (nJH,H) are given in Hertz (Hz).
Computer-assisted 1H iterative full spin analysis
Full spin analysis was carried out with the PERCH NMR software tools according to previously published methodology.[3] The resolution-enhanced 1H NMR spectrum was imported into the PERCH shell as JCAMP-DX file and subjected to baseline correction, peak picking, and integration. The X-ray crystal structures of 1 (CCDC ID 940680)[1,13] was used as a template to construct the molecular model of ecumicin using the PERCH molecular modeling system (MMS). Following geometry optimization and molecular dynamics simulations, the 1H NMR parameters in methanol-d4 were predicted using MMS. Following manual examination of the 1H assignments, the calculated 1H chemical shifts, signal line widths, and J-couplings were refined with PERCHit, using both the integral-transform (D) mode and the total-line-fitting (T) mode, until excellent agreement between the observed and simulated spectra was achieved to yield the 1H fingerprints of ecumicin (RMS < 0.2%).
Supplementary Material
Acknowledgments
The authors would like to thank Dr. James B. McAlpine for his very valuable comments and suggestions during manuscript preparation. We are also thankful to Dr. Ben Ramirez for his support in the NMR facility at the UIC Center for Structural Biology (CSB) and to Mr. Matthias Niemitz and Dr. Samuli-Petrus Korhonen for their support with PERCH NMR software program. Funding for the 900 MHz NMR spectrometer was provided by NIH (grant P41 GM068944) awarded to Dr. P.G.W. Gettins by NIGMS and is gratefully acknowledged. Finally, this study received partial support through the Cooperative Research Program for Agriculture Science & Technology Development (project no. PJ01128901 and PJ01133001), Rural Development Administration, Korea.
Footnotes
Dedication
This study is dedicated to Professor William Reynolds in recognition of his pioneering contributions to the NMR-based structural analysis of natural products.
Conflict of interest
The authors report no conflicts of interest.
Supporting Information
Additional supporting information may be found in the online version of this article at the publisher’s web site.
References
- 1.Gao W, Kim JY, Chen SN, Cho SH, Choi J, Jaki BU, Jin YY, Lankin DC, Lee JE, Lee SY, McAlpine JB, Napolitano JG, Franzblau SG, Suh JW, Pauli GF. Org. Lett. 2014;16:6044. doi: 10.1021/ol5026603. [DOI] [PMC free article] [PubMed] [Google Scholar]
- 2.Gao W, Kim JY, Anderson JR, Akopian T, Hong S, Jin YY, Kandror O, Kim JW, Lee IA, Lee SY, McAlpine JB, Mulugeta S, Sunoqrot S, Wang Y, Yang SH, Yoon TM, Goldberg AL, Pauli GF, Suh JW, Franzblau SG, Cho S. Antimicrob. Agents Chemother. 2015;59:880. doi: 10.1128/AAC.04054-14. [DOI] [PMC free article] [PubMed] [Google Scholar]
- 3.Napolitano JG, Godecke T, Rodriguez-Brasco MF, Jaki BU, Chen SN, Lankin DC, Pauli GF. J. Nat. Prod. 2012;75:238. doi: 10.1021/np200949v. [DOI] [PMC free article] [PubMed] [Google Scholar]
- 4.Pauli GF, Chen S-N, Lankin DC, Bisson J, Case RJ, Chadwick LR, Gödecke T, Inui T, Krunic A, Jaki BU, et al. J. Nat. Prod. 2014;77:1473. doi: 10.1021/np5002384. [DOI] [PMC free article] [PubMed] [Google Scholar]
- 5.Pauli GF, Jaki BU, Gödecke T, Lankin DC. J. Nat. Prod. 2012;75:834. doi: 10.1021/np200993k. [DOI] [PMC free article] [PubMed] [Google Scholar]
- 6.Napolitano JG, Lankin DC, McAlpine JB, Niemitz M, Korhonen SP, Chen SN, Pauli GF. J. Org. Chem. 2013;78:9963. doi: 10.1021/jo4011624. [DOI] [PMC free article] [PubMed] [Google Scholar]
- 7.Tiainen M, Maaheimo H, Niemitz M, Soininen P, Laatikainen R. Magn. Reson. Chem. 2008;46:125. doi: 10.1002/mrc.2140. [DOI] [PubMed] [Google Scholar]
- 8.Jaki B, Zerbe O, Heilmann J, Sticher O. J. Nat. Prod. 2001;64:154. doi: 10.1021/np000297e. [DOI] [PubMed] [Google Scholar]
- 9.Pavlaskova K, Nedved J, Kuzma M, Zabka M, Sulc M, Sklenar J, Novak P, Benada O, Kofronova O, Hajduch M, Derrick PJ, Lemr K, Jegorov A, Havlicek V. J. Nat. Prod. 2010;73:1027. doi: 10.1021/np900472c. [DOI] [PubMed] [Google Scholar]
- 10.Simmons TL, Nogle LM, Media J, Valeriote FA, Mooberry SL, Gerwick WH. J. Nat. Prod. 2009;72:1011. doi: 10.1021/np9001674. [DOI] [PMC free article] [PubMed] [Google Scholar]
- 11.Iwasaki A, Ohno O, Sumimoto S, Matsubara T, Shimada S, Sato T, Suenaga K. J Nat Prod. 2015;78:901. doi: 10.1021/acs.jnatprod.5b00168. [DOI] [PubMed] [Google Scholar]
- 12.Napolitano JG, Lankin DC, Graf TN, Friesen JB, Chen SN, McAlpine JB, Oberlies NH, Pauli GF. J. Org. Chem. 2013;78:2827. doi: 10.1021/jo302720h. [DOI] [PMC free article] [PubMed] [Google Scholar]
- 13.Crystallographic data for ecumicin reported in this paper have been deposited at the Cambridge crystallographic Data Centre (CCDC) under the deposition number 940680. These data can be obtained free of charge via http://www.ccdc.cam.ac.uk/data_request/cif, or by e-mailing data_request@ccdc.cam.ac.uk, or by CCDC, 12 Union Road, Cambridge CB21EZ, UK; fax: +44(0)-1233-336033.
Associated Data
This section collects any data citations, data availability statements, or supplementary materials included in this article.


