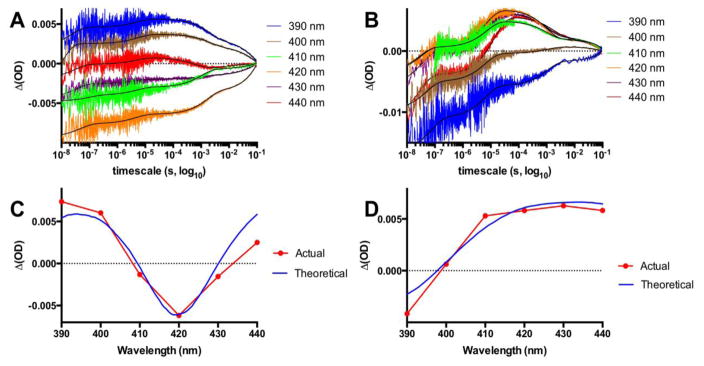
Fig. 2.
Transient absorption traces for the dQ403W-1 recorded from 390 to 440 nm and spanning 10 ns to 0.1 s showing the formation of the reduced heme species noticeable at 390 and 400 nm in the substrate free conformation (A) and at 410–440 nm in the NPG bound form (B) with the lines of best fit in black. Panels C and D show the difference spectra for the actual ΔOD data points at 100 μs versus the theoretical difference spectra generated from original Fe(II) and Fe(III) spectra for the low spin substrate free (C) and high spin NPG bound (D).

