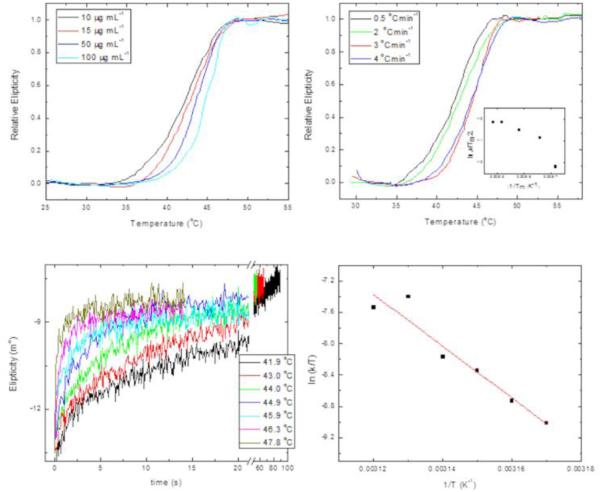
Figure 10.
Temperature-induced denaturation of LvTIM-Cys47Ala. Panel (A) Thermal denaturation transitions of LvTIM-Cys47Ala obtained at different protein concentrations as indicated on the legend. All transitions at this panel were obtained at a heating rate of 2 °C min−1. Panel (B) Thermal denaturation profiles of LvTIM-Cys47Ala obtained at different heating rates. All profiles at this panel were measured using a protein concentration of 15 μg mL−1. The inset shows the plot ln versus 1/Tm made with data from transitions of this panel. Panel (C) unfolding kinetic traces of LvTIM-Cys47Ala obtained at different temperatures. Protein concentration was 15 μg mL−1. Panel (D) Eyring’s plot for the rate constants of unfolding calculated from kinetic traces shown on panel C. In panels A and B, the data have been normalized for ease of comparison. All the experiments on this figure were performed using Tris 20 mM buffer at pH 7.4.

