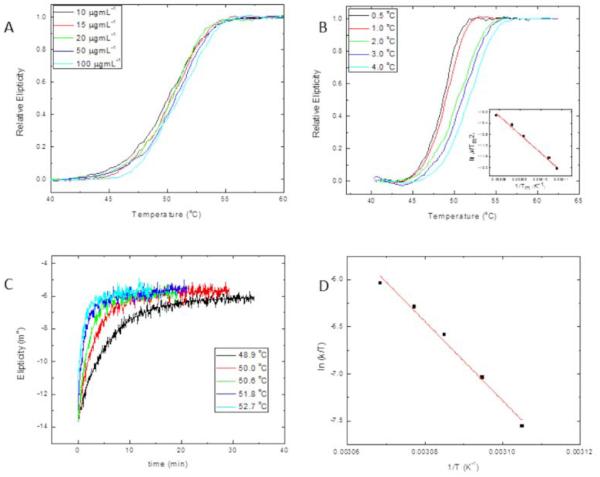
Figure 4.
Temperature-induced denaturation of LvTIM. Panel (A) Thermal denaturation transitions of LvTIM obtained at different protein concentrations as indicated on the legend. All transitions on this panel were obtained at a heating rate of 2 °Cmin−1. Panel (B) Thermal denaturation profiles of LvTIM obtained at different heating rates. All profiles of this panel were measured using a protein concentration of 15 μg mL−1. The inset shows the plot ln versus 1/Tm made with data from transitions of this panel. Panel (C) unfolding kinetic traces of LvTIM obtained at different temperatures. Smooth lines correspond to fitting of experimental data to single exponential decay equation. Protein concentration was 15 μg mL−1. Panel (D) Eyring’s plot for the rate constants of unfolding calculated from kinetic traces shown on panel C. In panels A and B, the data have been normalized for ease of comparison. All the experiments on this figure were performed using Tris 20 mM buffer at pH 7.4.

