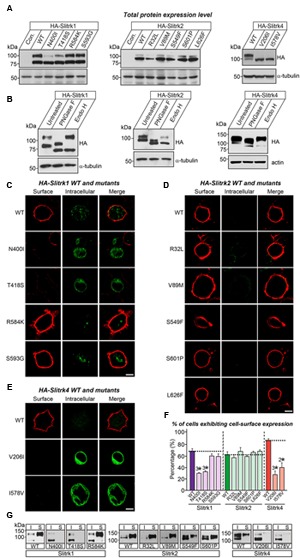
FIGURE 3.

Impaired glycosylation and surface trafficking of a subset of Slitrk mutations. (A) Representative immunoblot images from HEK293T cells transfected with the indicated WT or mutant forms of HA-tagged Slitrk1, Slitrk2, or Slitrk4. Samples containing equal amounts of protein were resolved by SDS-PAGE and immunoblotted using anti-HA antibodies; α-tubulin was used for normalization. Molecular mass markers are labeled in kilodaltons. (B) Immunoblot analysis of Endo-H and PNGase F enzyme-digested lysates of HEK293T cells expressing WT HA-tagged Slitrk; α-tubulin or actin was used for normalization. Molecular mass markers are labeled in kilodaltons. (C-E) Surface expression analysis of HEK293T cells expressing WT or point mutant forms of HA-tagged Slitrk1 (C), Slitrk2 (D), or Slitrk4 (E). Transfected cells were immunostained with mouse anti-HA antibodies (red) and detected with Cy3-conjugated anti-mouse secondary antibodies under non-permeabilized conditions, followed by permeabilization of cells. Cells were then stained first with rabbit anti-HA antibodies (green) and then with FITC-conjugated anti-rabbit secondary antibodies. Scale bar, 10 μm (applies to all images). (F) Quantification of the proportion of cells exhibiting surface expression of Slitrks. All data are shown as means ± SEMs (2∗p < 0.01; 3∗p < 0.001; ANOVA with post hoc Tukey’s test; p-value of WT Slitrk1 vs Slitrk1[N400I] = 0.000033; p-value of WT Slitrk1 vs Slitrk1[T418S] = 0.000065; p-value of WT Slitrk1 vs. Slitrk1[R584K] = 0.259; p-value of WT Slitrk1 vs. Slitrk1[S593G] = 0.34; p-value of WT Slitrk2 vs. Slitrk2[R32L] = 0.941; p-value of WT Slitrk2 vs. Slitrk2[V89M] = 0.948; p-value of WT Slitrk2 vs. Slitrk2[S549F] = 0.988; p-value of WT Slitrk2 vs. Slitrk2[S601P] = 0.997; p-value of WT Slitrk2 vs. Slitrk2[L626F] = 0.996; p-value of WT Slitrk4 vs. Slitrk4[V206I] = 0.000677; p-value of WT Slitrk4 vs. Slitrk4[I578V] = 0.003946). The numbers of cells counted (n) were as follows: WT Slitrk1, n = 360; Slitrk1[N400I], n = 327; Slitrk1[T418S], n = 412; Slitrk1[R584K], n = 496; Slitrk1[S593G], n = 333; WT Slitrk2, n = 345; Slitrk2[R32L], n = 321; Slitrk2[V89M], n = 371; Slitrk2[S549F], n = 360; Slitrk2[S601P], n = 313; Slitrk2[L626F], n = 319; WT Slitrk4, n = 256; Slitrk4[V206I], n = 181; and Slitrk4[I578V], n = 161. (G) Slitrk surface exposure on transfected HEK293T cells, analyzed by immunoblotting of affinity-purified, surface-biotinylated Slitrk proteins. Biotinylated cell surface proteins (S) and total lysate proteins (I) were assessed by immunoblot with anti-HA antibodies. Input, 5% of total lysates used in biotinylation experiments. Note that mutants of Slitrk1 (N400I and T418S) and Slitrk4 (V206I and I578V) exhibit impaired surface expression, as similarly observed in (C-F).
