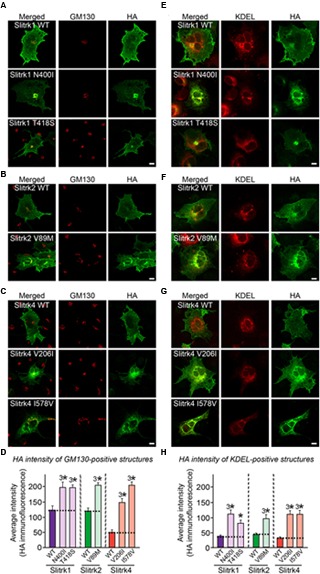
FIGURE 5.

Retention of Slitrk mutant proteins in the cis-Golgi and ER in COS-7 cells. (A-C) Immunofluorescence staining of COS-7 cells demonstrates cis-Golgi retention of a subset of mutants. COS-7 cells were transfected with WT or mutant forms of HA-tagged Slitrk1 (A), Slitrk2 (B), or Slitrk4 (C), and then stained with anti-HA (green) and anti-GM130 (red) antibodies. Scale bar, 10 μm (applies to all images). (D) Quantification of the average intensity of GM130-positive Slitrks. All data are shown as means ± SEMs (3∗p < 0.001; ANOVA with post hoc Tukey’s test; p-value of WT Slitrk1 vs Slitrk1[N400I] = 0.00053; p-value of WT Slitrk1 vs. Slitrk1[T418S] = 0.000383; p-value of WT Slitrk2 vs. Slitrk2[V89M] = 1.83943E-7; p-value of WT Slitrk4 vs. Slitrk4[V206I] = 8.0637E-9; p-value of WT Slitrk4 vs. Slitrk4[I578V] = 5.1018E-9). The numbers of cells counted were as follows: WT Slitrk1, n = 26; Slitrk1[N400I], n = 22; Slitrk1[T418S], n = 24; WT Slitrk2, n = 24; Slitrk2[V89M], n = 27; WT Slitrk4, n = 19; Slitrk4[V206I], n = 22; and Slitrk4[I578V], n = 23. (E-G) Immunofluorescence staining of COS-7 cells demonstrates ER retention of mutants. COS-7 cells were transfected with WT or mutant forms of HA-tagged Slitrk1 (E), Slitrk2 (F), or Slitrk4 (G), together with BFP-KDEL (red; pseudo-colored). The cells were then stained with anti-HA (green). Scale bar, 10 μm (applies to all images). (H) Quantification of the average intensity of KDEL-positive Slitrks. All data are shown as means ± SEMs (∗p < 0.05, 3∗p < 0.001; ANOVA with post hoc Tukey’s test; p-value of WT Slitrk1 vs. Slitrk1[N400I] = 0.000093; p-value of WT Slitrk1 vs. Slitrk1[T418S] = 0.036; p-value of WT Slitrk2 vs. Slitrk2[V89M] = 0.000712; p-value of WT Slitrk4 vs. Slitrk4[V206I] = 0.000257; p-value of WT Slitrk4 vs. Slitrk4[I578V] = 0.000458). The numbers of cells counted were as follows: WT Slitrk1, n = 26; Slitrk1[N400I], n = 24; Slitrk1[T418S], n = 22; WT Slitrk2, n = 17; Slitrk2[V89M], n = 23; WT Slitrk4, n = 22; Slitrk4[V206I], n = 22; and Slitrk4[I578V], n = 21.
