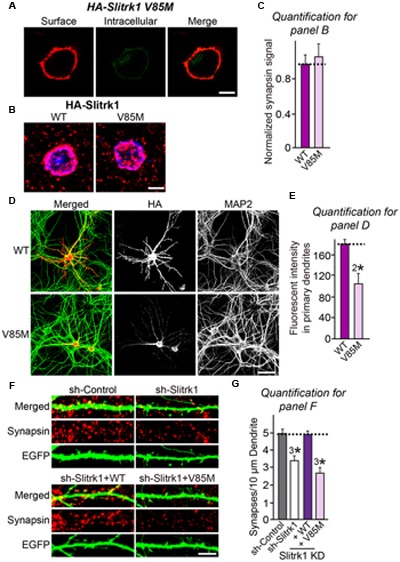
FIGURE 9.

Characterization of the Slitrk1[V85M] mutant in heterologous synapse-formation assays and transfected neurons. (A) Surface expression analysis of HEK293T cells expressing HA-tagged Slitrk1[V85M]. Transfected cells were immunostained with mouse anti-HA antibodies (red) and detected with Cy3-conjugated anti-mouse secondary antibodies under non-permeabilized conditions, followed by permeabilization of cells. Cells were then stained first with rabbit anti-HA antibodies (green) and then with FITC-conjugated anti-rabbit secondary antibodies. Scale bar, 10 μm (applies to all images). (B,C) Representative images (B) and summary graph (C) of heterologous synapse-formation activities of WT Slitrk1 and Slitrk1[V85M]. Neurons were stained with antibodies against HA (blue; pseudo-colored) and synapsin (red). Scale bar, 10 μm (applies to all images). ‘n’ denotes the number of HEK293T cells analyzed: WT Slitrk1, n = 13; and Slitrk1[V85M], n = 12. (D) Fluorescence images of hippocampal neurons transfected with WT HA-Slitrk1 or HA-Slitrk1[V85M], at DIV8. After 48 h (DIV10), the transfected neurons were double-immunostained for antibodies against the somatodendritic marker MAP2 (green) and HA (red). Note that Slitrk1[V85M] exhibits decreased dendritic targeting. Scale bar, 50 μm (applies to all images). (E) Dendritic targeting of WT HA-Slitrk1 or HA-Slitrk1[V85M] in hippocampal neurons was quantified by measuring fluorescent intensity (HA) in primary dendrites. All data are shown as means ± SEM (2∗p < 0.01; Student’s t-test; p-value = 0.00215). ‘n’ denotes the number of neurons as follows: WT Slitrk1, n = 15 and Slitrk1[V85M], n = 13. (F,G) Representative images (F) and summary graph (G) of neuron transfection assays with a lentiviral vector expressing sh-Control, sh-Slitrk1, or coexpressing sh-Slitrk1 and the indicated shRNA-resistant Slitrk1 vectors at DIV8 and analyzed at DIV14 by double-immunofluorescence staining with antibodies to EGFP (green) and synapsin (red). Scale bar, 5 μm (applies to all images). All data are shown as means ± SEMs (3∗p < 0.001; ANOVA with post hoc Tukey’s test; p-value of sh-Control vs. sh-Slitrk1 = 0.000411; p-value of sh-Control vs. sh-Slitrk1+WT Slitrk1 = 0.991; and p-value of sh-Control vs sh-Slitrk1+Slitrk1[V85M] = 2.74E-7). ‘n’ denotes the number of neurons quantified as follows: sh-Control, n = 15, sh-Slitrk1, n = 15, sh-Slitrk1+WT Slitrk1, n = 15; and sh-Slitrk1+Slitrk1[V85M], n = 17.
