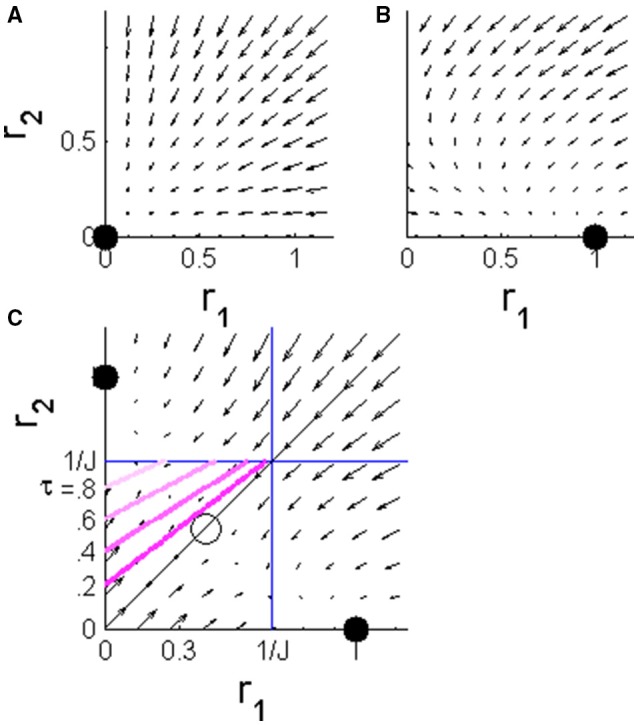
Figure 2.

The phase plane of the WTA rate model during different stages of the dynamics. The arrows show the vector in the plane of [r1, r2]. (A) Before the input populations begin to respond to the stimulus, t < T, the system is dominated by a single fixed point at the origin. (B) During the stimulus selective response period of the upstream input, T < t < T + τ, the single fixed point shifts to a state in which population 1 outrivals population 2 (in the case of input in the preferred stimulus of population 1, as in the example in Figure 1). (C) After the stimulus selective response, T + τ < t, both inputs to the competing populations are the same. The system has two stable fixed points corresponding to the states in which one population outrivals the other and fully suppresses it. The identity line (solid black) is the borderline between the basins of attraction of the two fixed points. The pink lines show the borderlines between the regions of the phase plane in which the initial conditions will result in a correct decision (below the line) and an incorrect decision (above) for different values of τ = 0.2, 0.4, 0.6, and 0.8; that is, the initial conditions that lead to r2(T + τ) = r1(T + τ).
