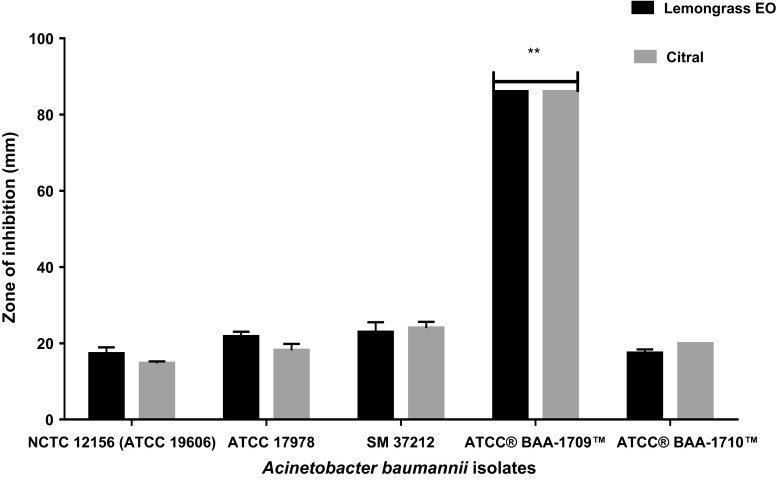
Fig. 1.
Comparison of the inhibition zones (mm) of whole lemongrass EO (black bars) and citral (grey bars) against A. baumannii isolates measured on agar medium. **The disk diffusion of ATCC® BAA-1709™ is significantly different from the other isolates (P = 0.02). When the disk diffusion of the other four isolates were compared, there was no significant difference (P = 0.25)

