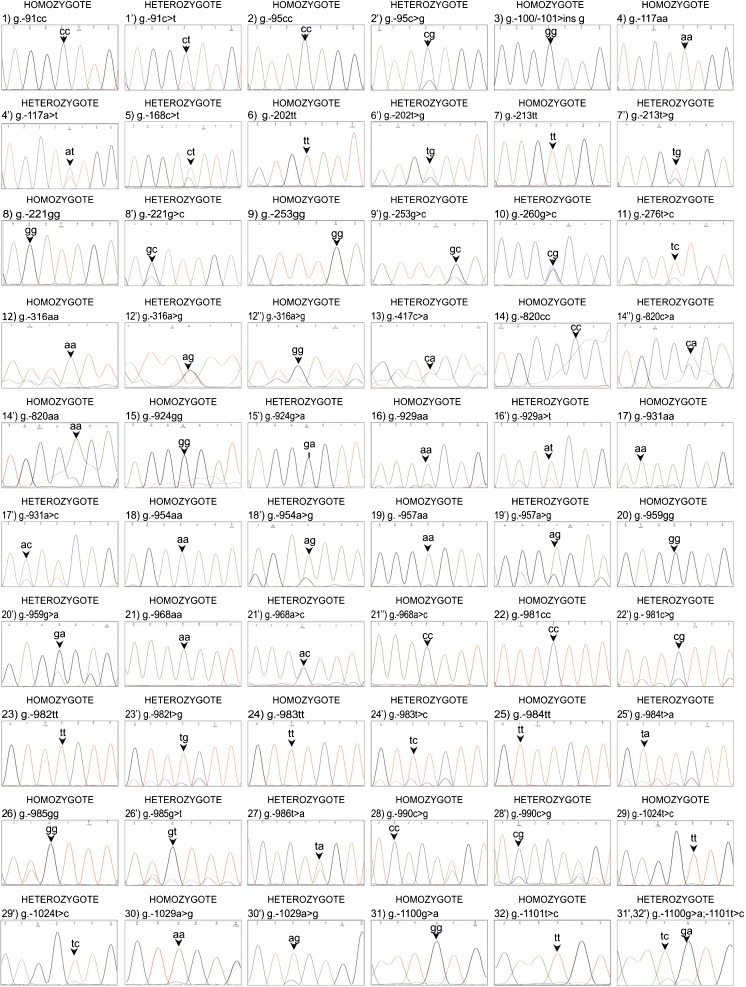
Fig. 2.
Chromatograms of identified SNPs (arrows) in homozygotes and heterozygotes within the promoter sequence region (from g.-91C>T to g.-1029A>G) of the pPAG2-L subfamily in crossbreed pigs. [For an interpretation of the references to color in this figure legend, the reader is referred to the web version of this article]

