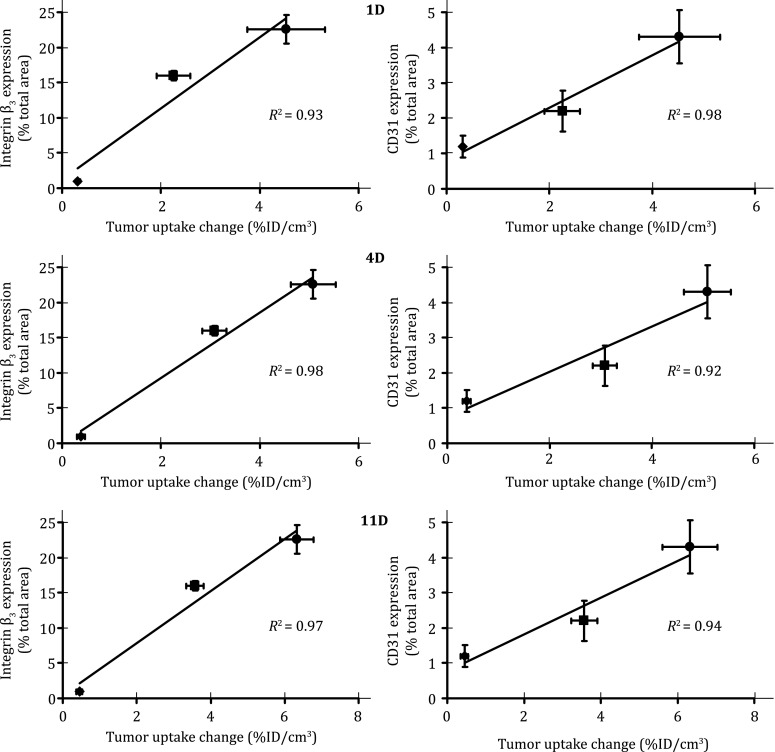
Fig. 10.

Linear relationship between the %ID/cm3 tumor uptake change at days 1 (top), 4 (middle) and 11 (bottom) after linifanib therapy and the expression levels of the αvβ3 (left) and CD31 (right) in three tumor-bearing animal models. The %ID/cm3 tumor uptake values of 99mTc-3P-RGD2 were calculated from SPECT/CT quantification and reported as the mean plus/minus standard error of the mean based on results from five animals (n = 5). The %ID/cm3 tumor uptake change was calculated by deducting the %ID/cm3 tumor uptake of 99mTc-3P-RGD2 on days 1, 4, and 11 from its original value on −1 day (before linifanib therapy) in the same animal. The average %ID/cm3 tumor uptake change is used as the indicator of tumor response to linifanib treatment. The experimental data were adapted from Zheng et al. (2014)
