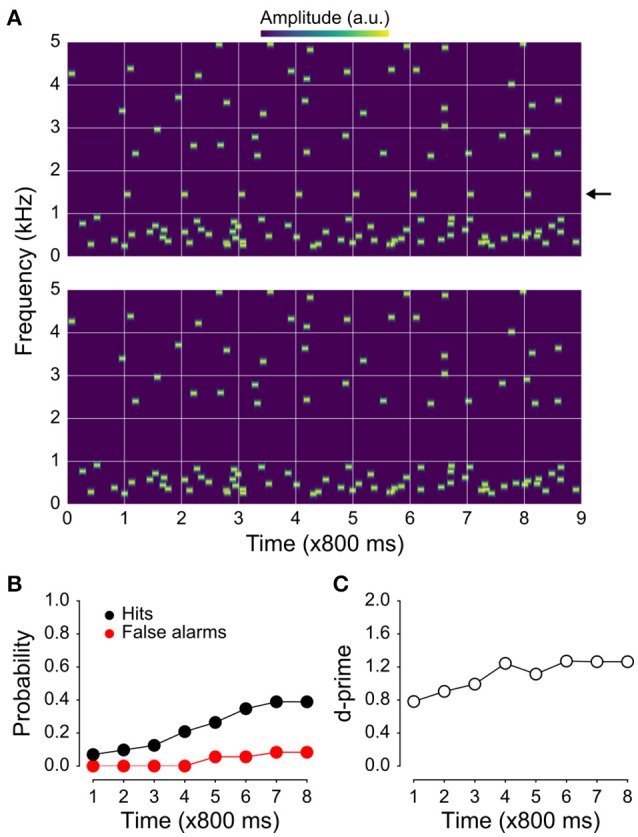
Figure 1.

Example stimuli and behavioral results. (A) Spectrogram of the jittered multi-tone masker stimulus used in the present study with regularly repeating target tones at 1 kHz (top), and the same stimulus with the targets absent (bottom). (B) Hit and false-alarm rates. The false-alarm rate across time since sequence onset is shown in red; hit rate in black. Although the target tones are easily segregated visually in the spectrograms shown in (A), they were not as easy to detect. Hit rates were substantially higher than false-alarm rates, resulting in target-sensitivity (d′) values (C) greater than one by the 4th position in the stimulus sequence. The fact that d′ values are initially rather high after only one target-tone presentation likely reflects the nature of the task (i.e., that two target tones prior to the awareness-indicating button press are included in the “detected” bin and counted as hits).
