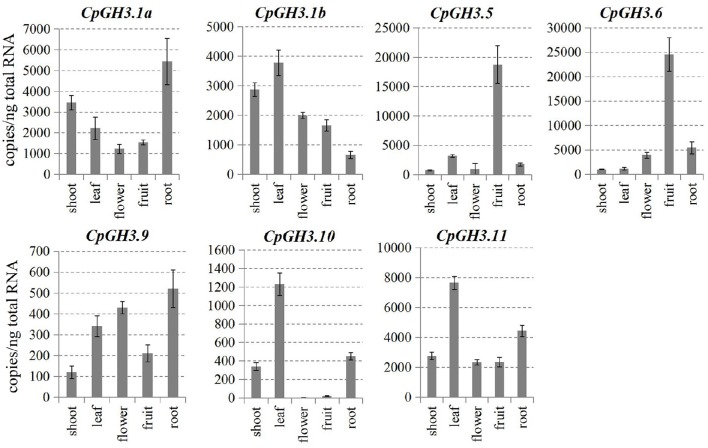
Figure 3.
Tissue-specific expression patterns of CpGH3 genes. Expression patterns of CpGH3 genes were analyzed by absolute quantification RT-PCR; tissue samples were collected from leaf, shoot, root, flower, and fruit of 2-year-old plants. RNA from each tissue was isolated for qRT-PCR. The data were obtained from five independent repeats, and standard deviations are shown with error bars.

